
₿itcoin Good Fiat Bad PRO
Unlimited access to Chat with Charts, Email Alerts on indicator intraday changes, and more.
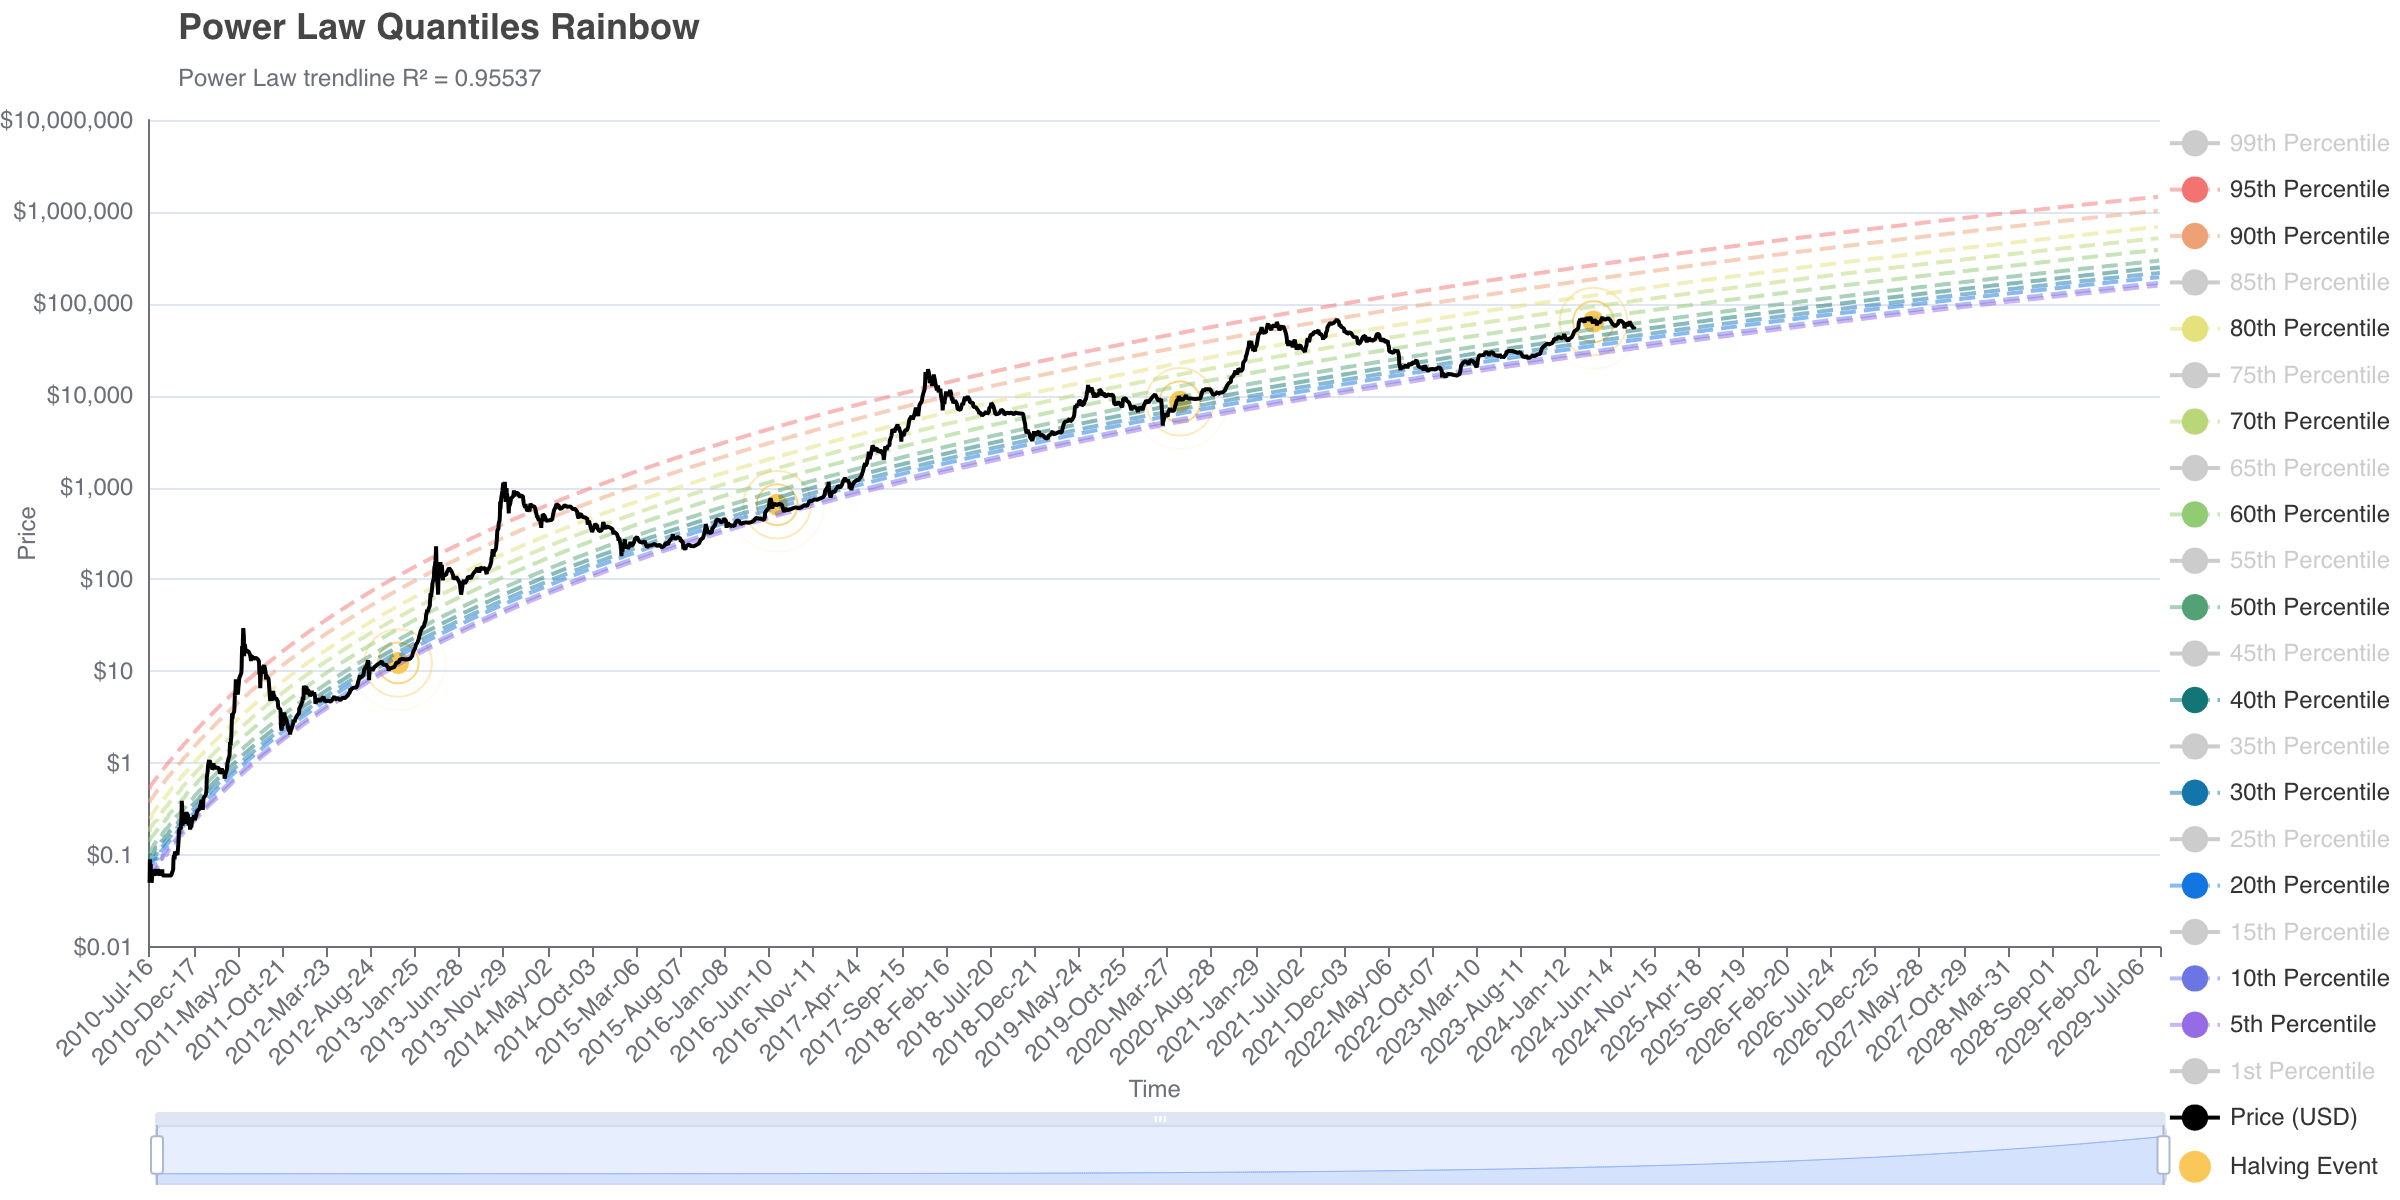
Power Law Probability Bands
This chart visualizes the Power Law quantile bands, helping to identify the upper and lower bounds for Bitcoin's price movement. It's a widely used tool for spotting market extremes and potential support or resistance levels.
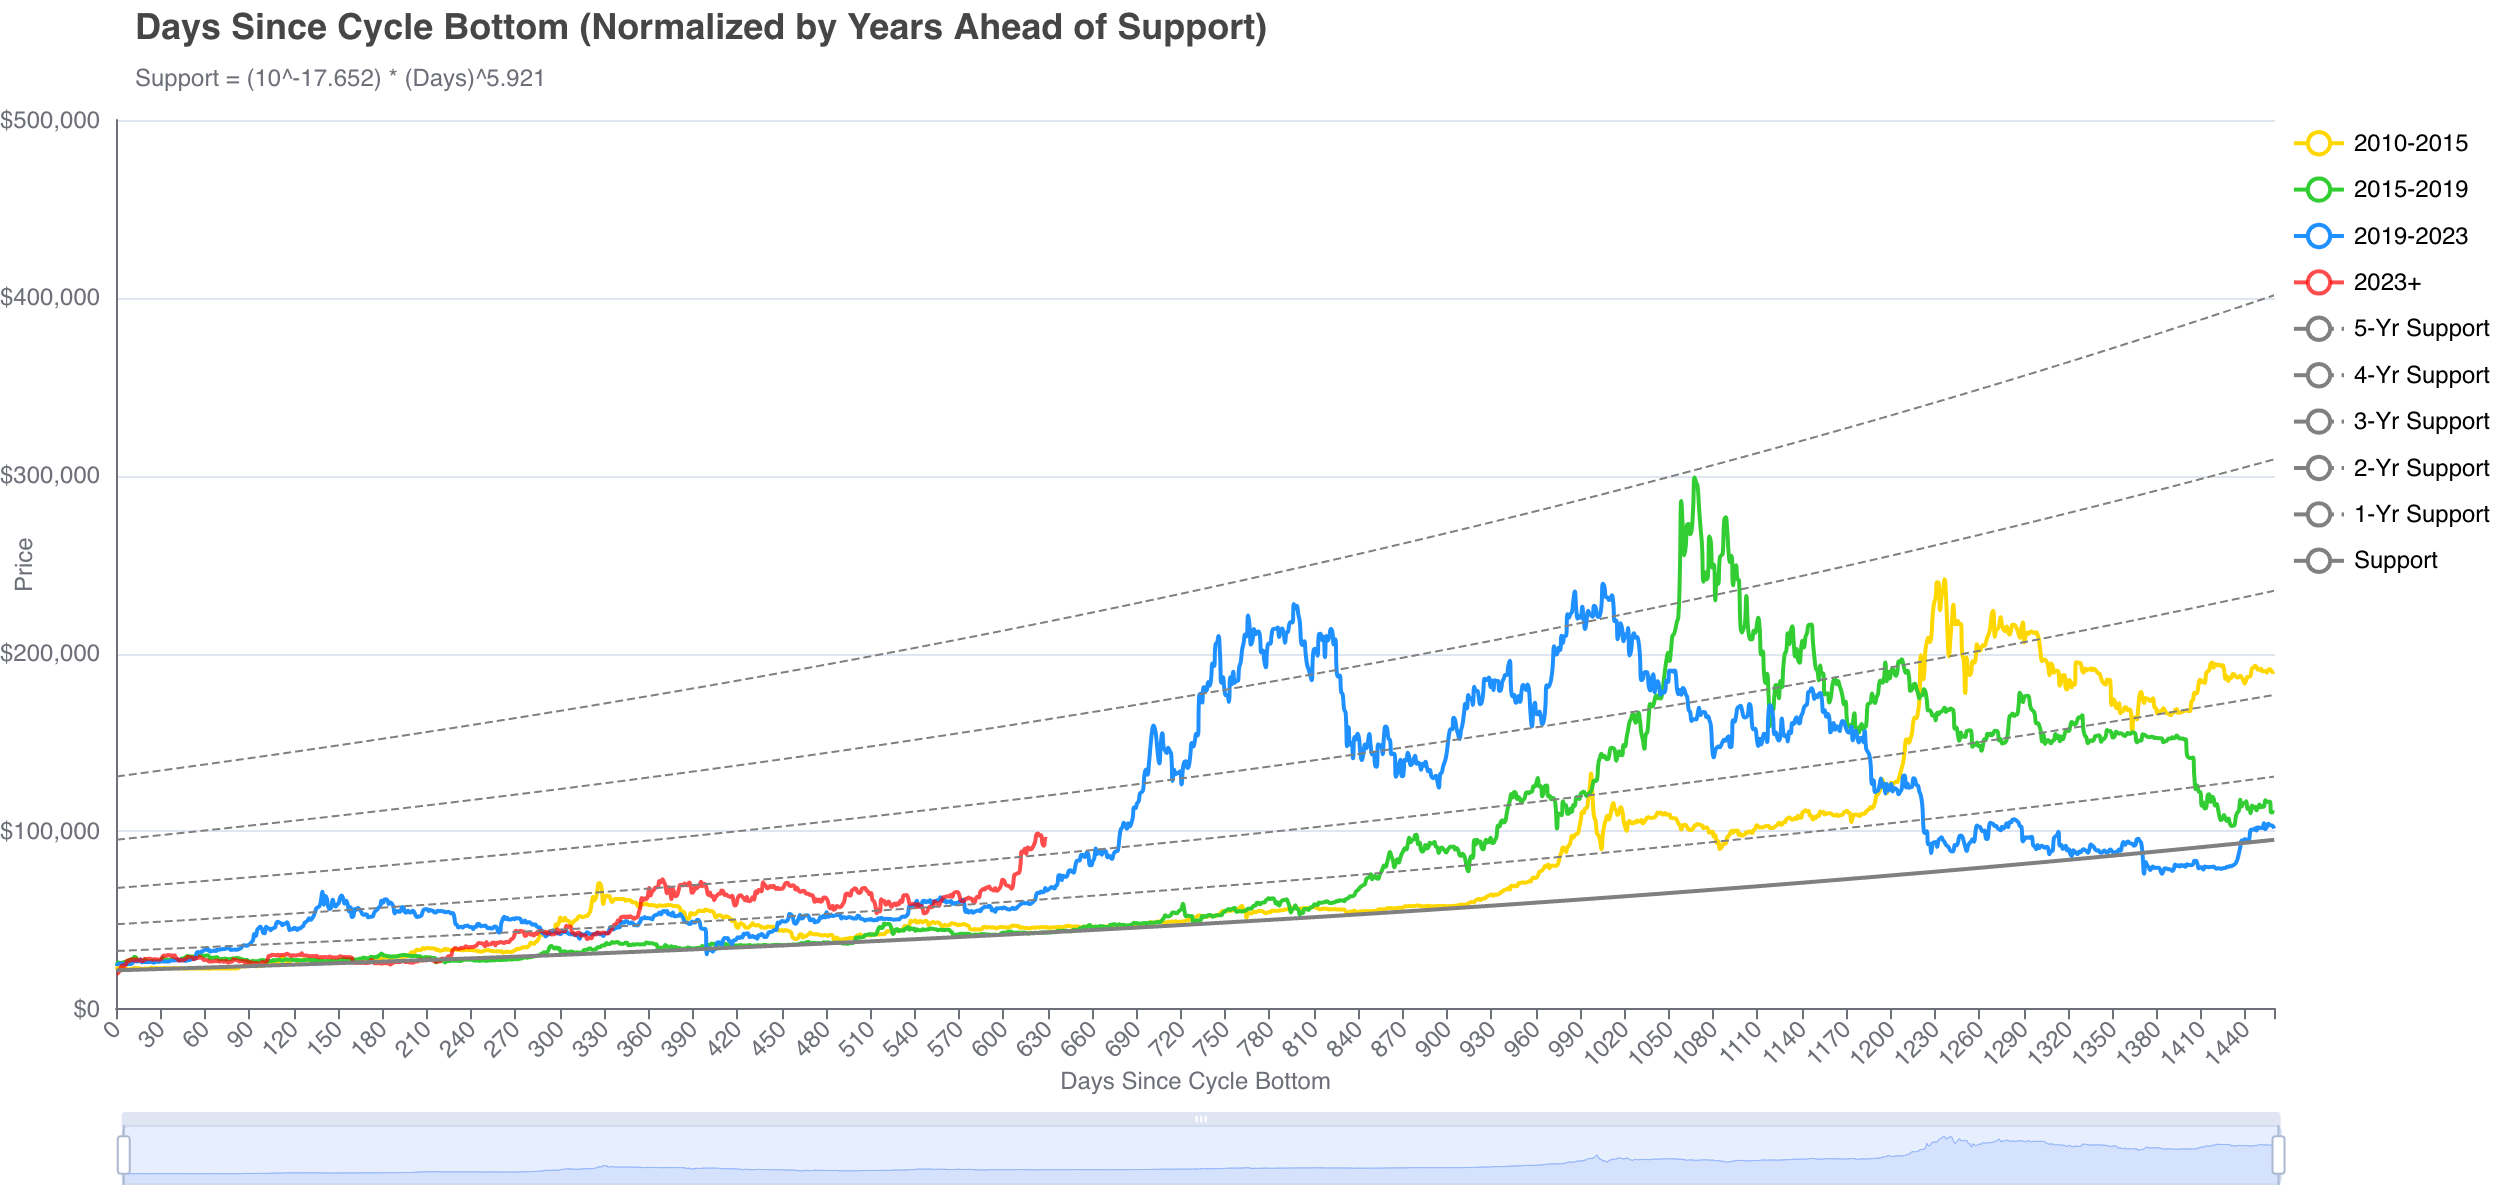
Days Since Cycle Bottom (Support-Normalized)
This chart visualizes Bitcoin's price trajectories for each cycle's market bottom. Using a Power Law quantile regression to adjust prices, it highlights Bitcoin's distance above or below long-term support and overlays past cycles to reveal similarities, divergences, and patterns. Can be used to guage market sentiment regarding recovery from market bottoms.
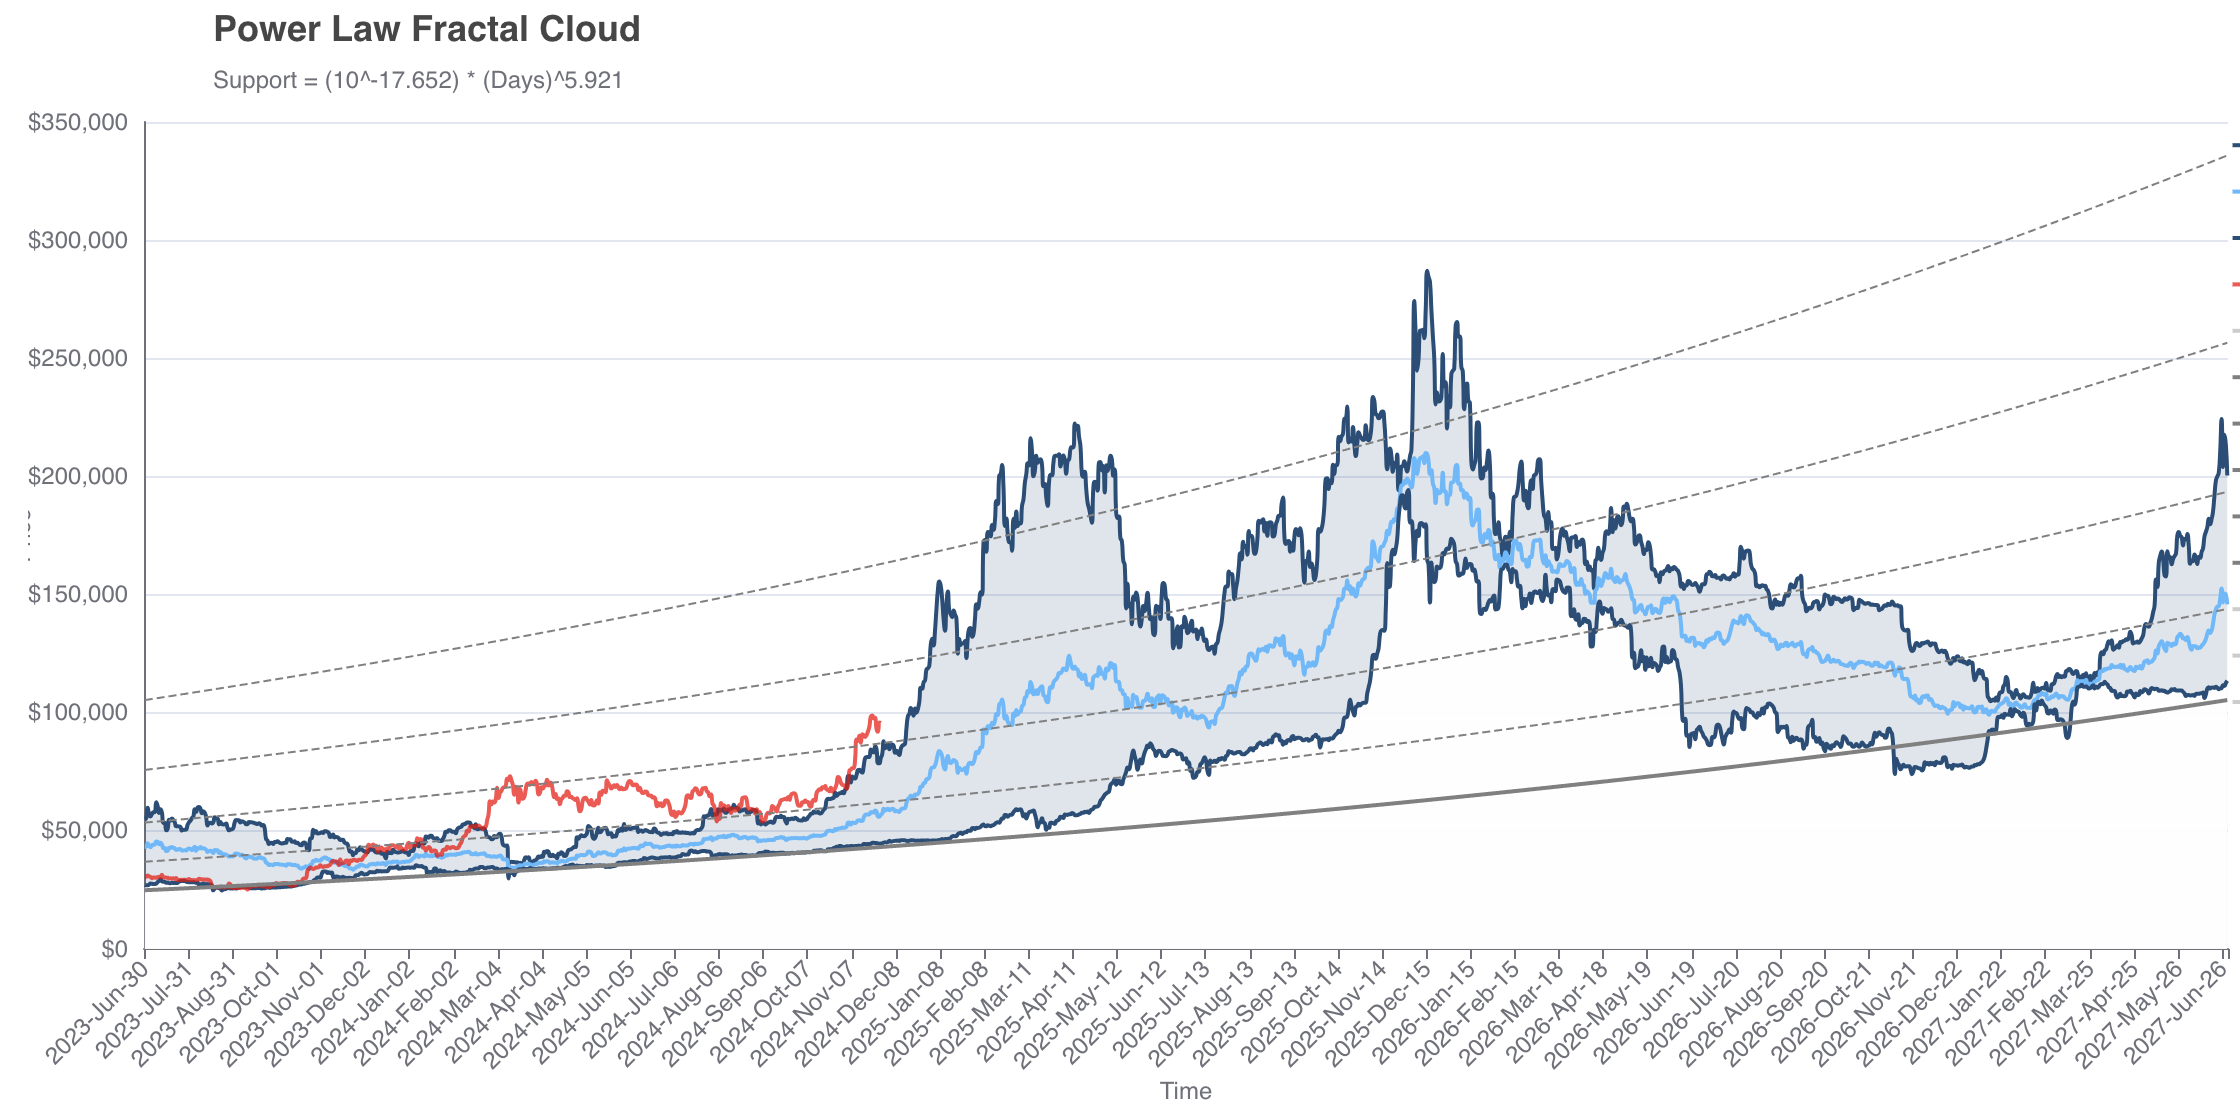
Power Law Fractal Cloud
This chart visualizes Bitcoin's price cycles using fractals overlaid onto a predictive "cloud." The fractals are derived from three historical four-year cycles (2011-2015, 2015-2019, 2019-2023) and scaled using a unique metric called "years ahead of support," which measures how far Bitcoin's price is from its long-term power law support.
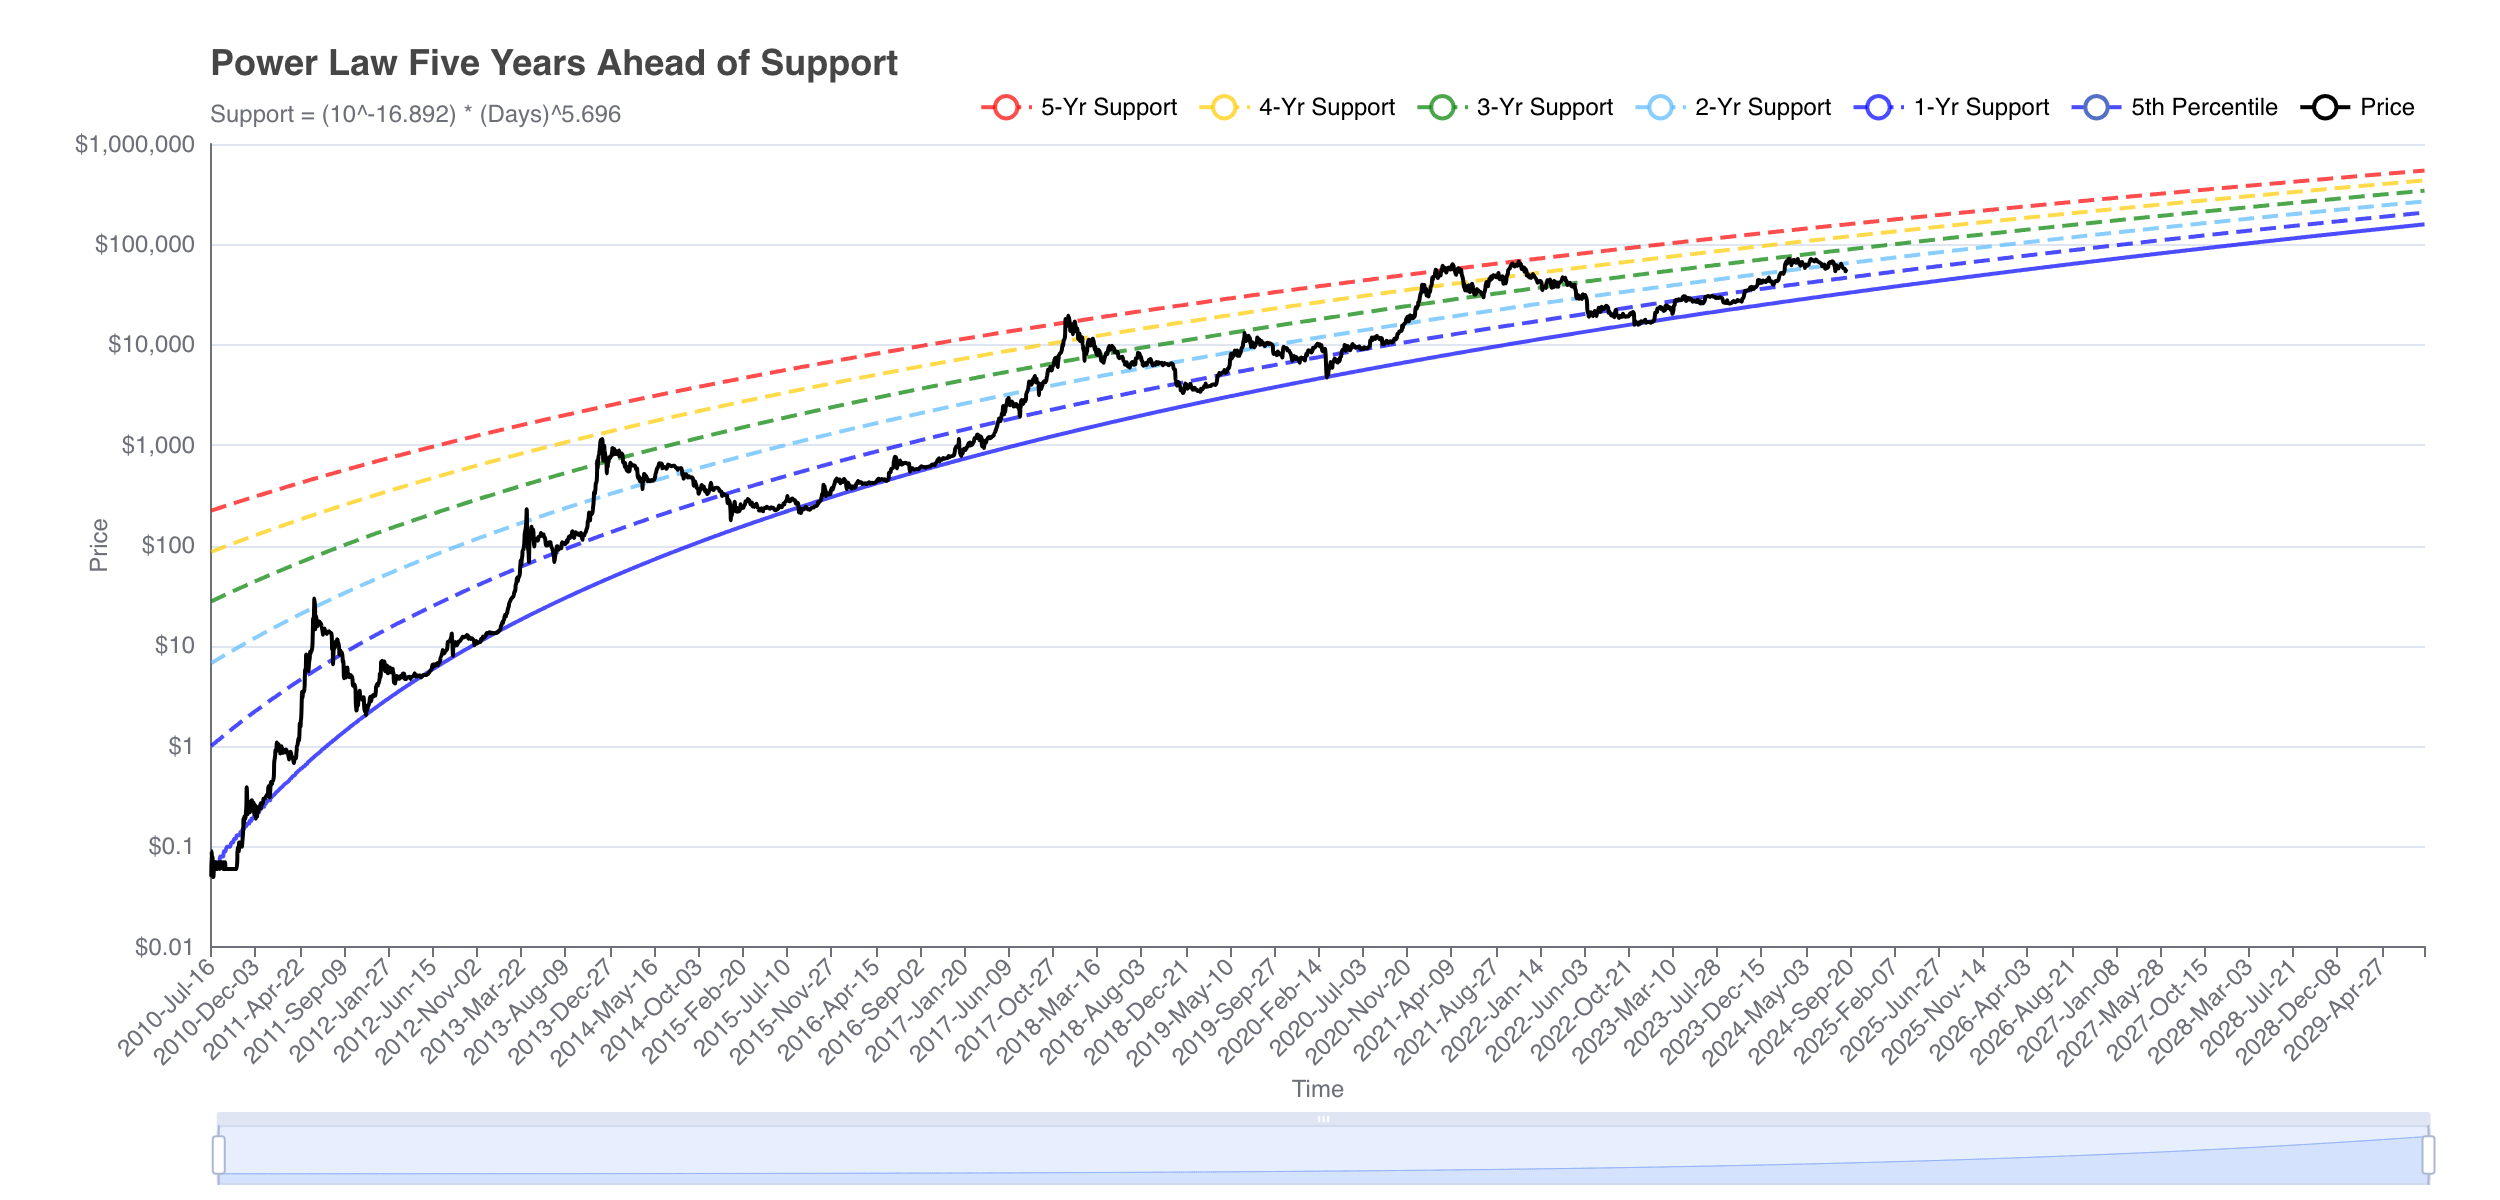
Power Law Five Years Ahead of Support
This chart tracks how many years ahead Bitcoin is trading compared to its long-term Power Law support level. It is used to gauge the potential risk of overextension in the market.
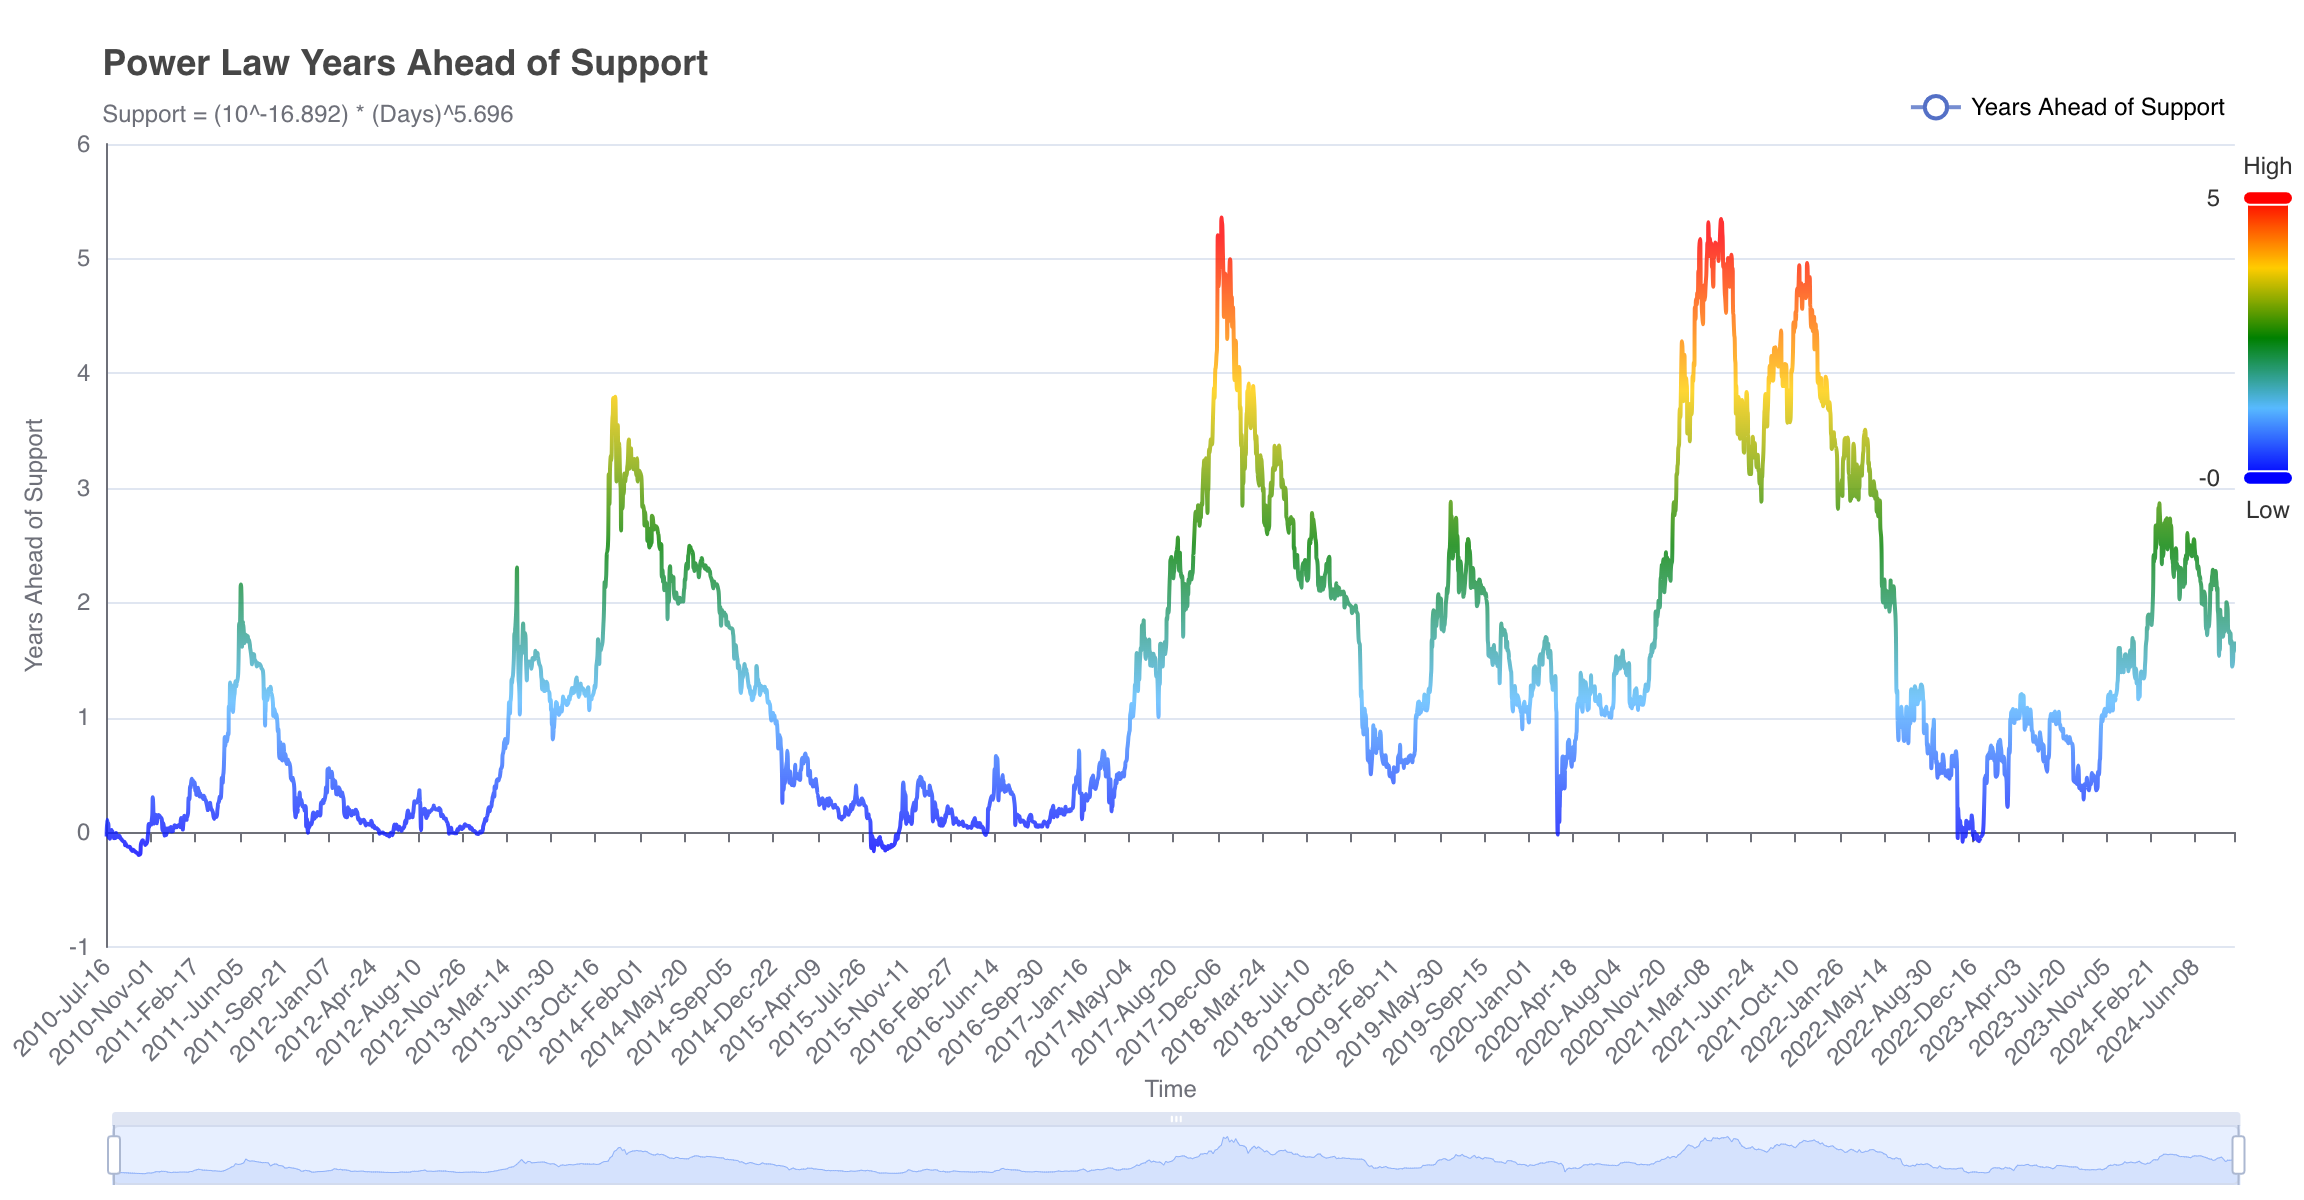
Power Law Years Ahead of Support
This visualization measures the number of years Bitcoin is trading above its Power Law support on a more granular timeframe, helping analysts spot periods of overvaluation or undervaluation.
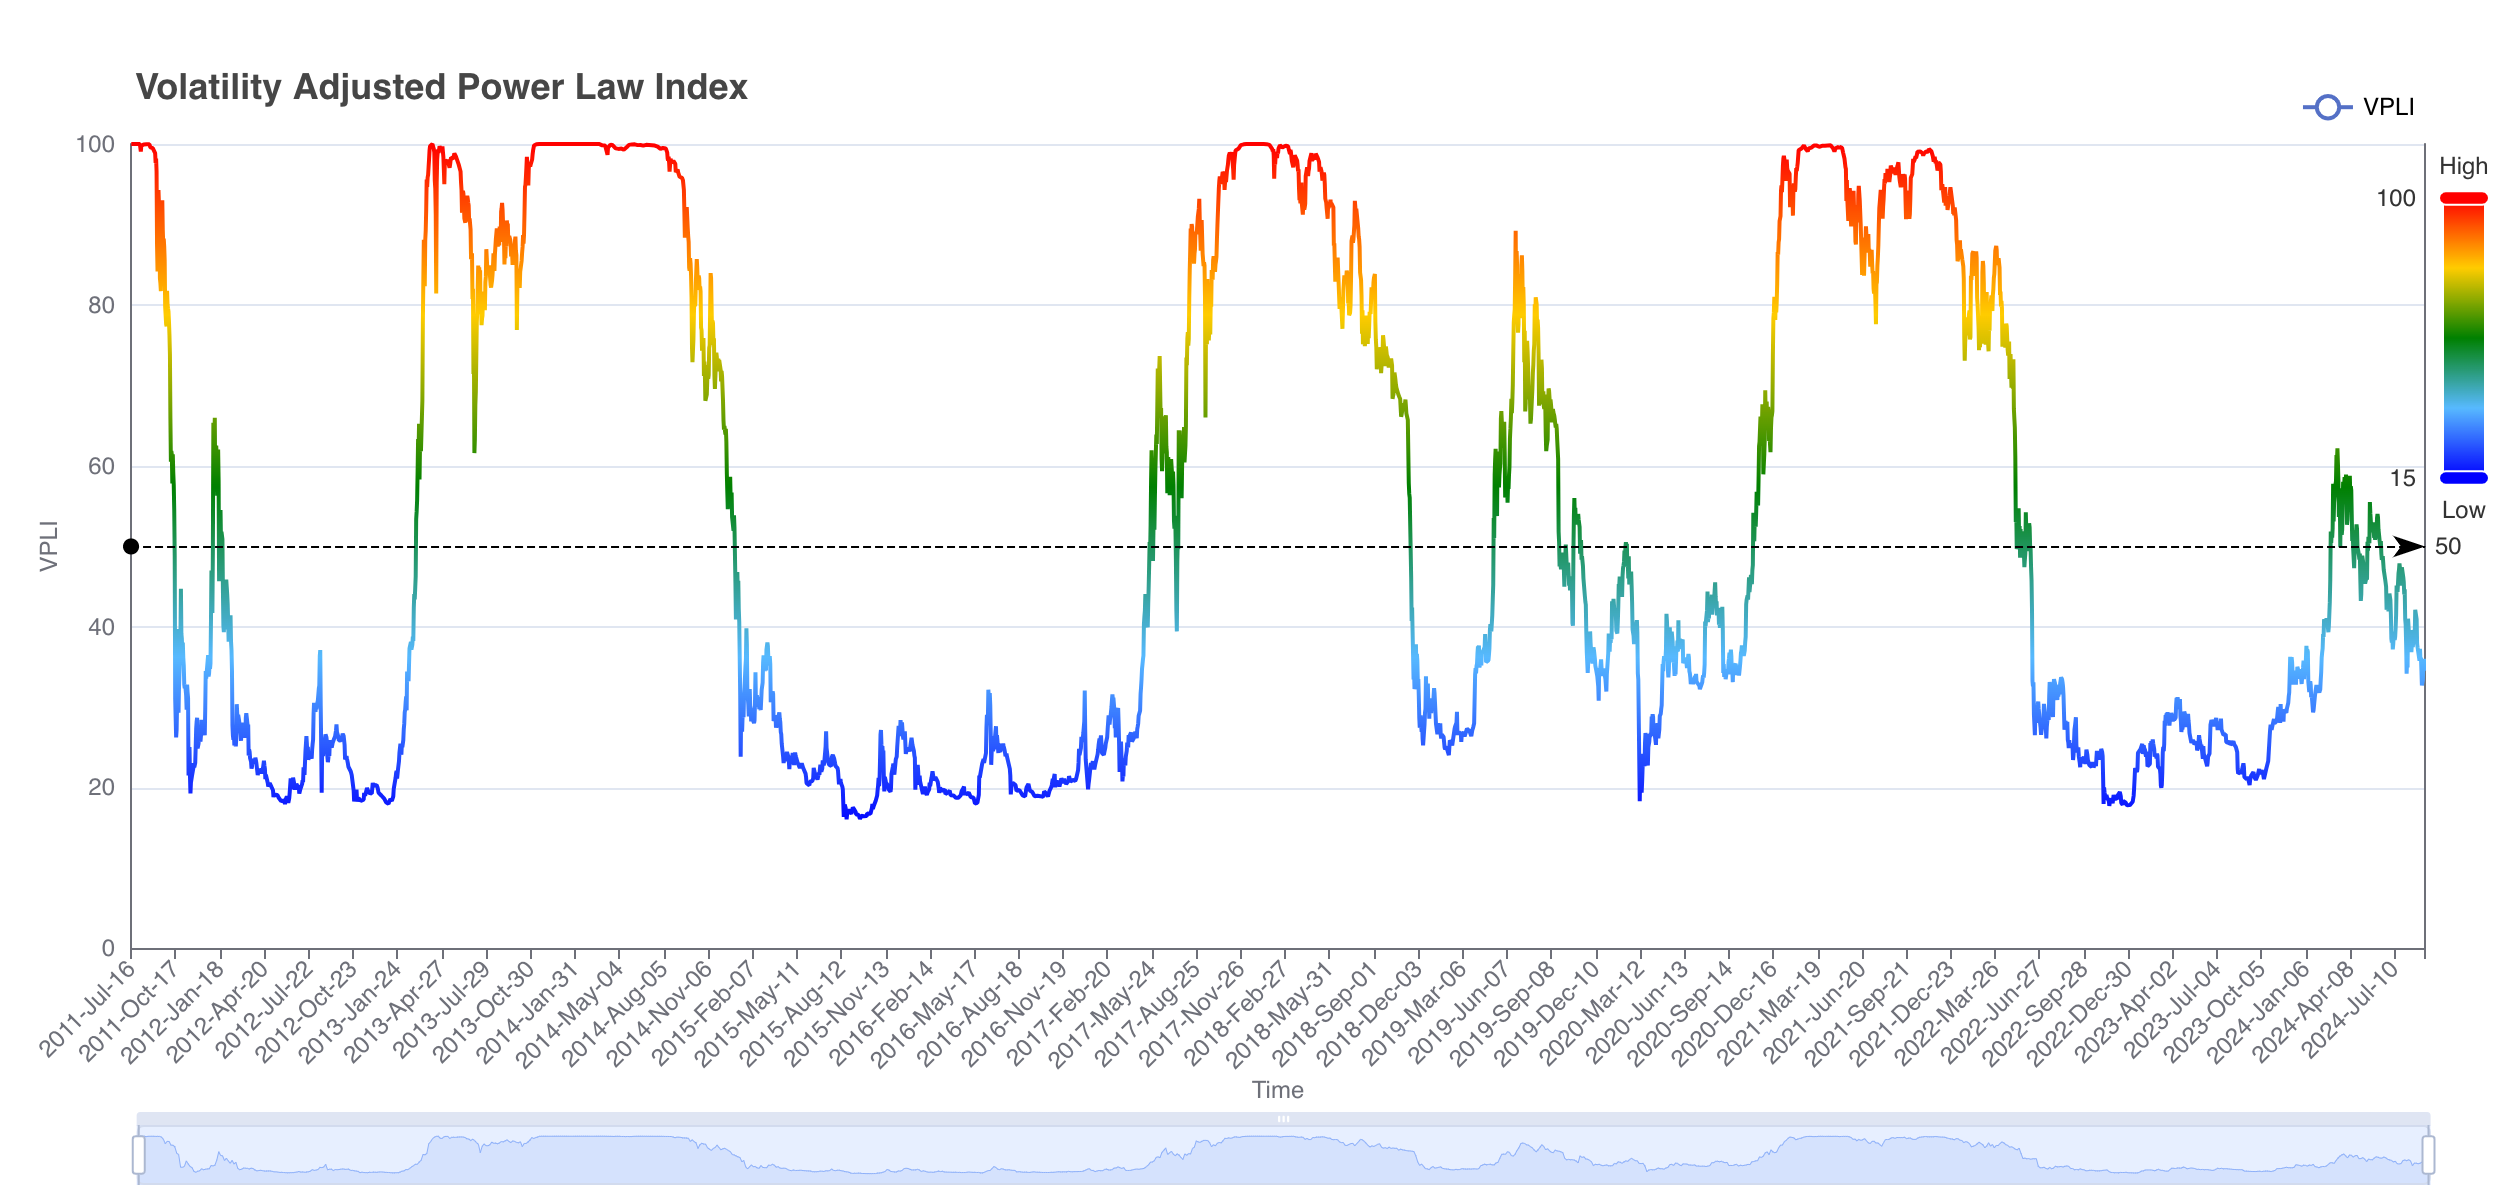
Volatility Adjusted Power Law Index
This chart adjusts the Power Law index by taking volatility into account. It provides a refined perspective on price trends by factoring in market volatility, often giving a more balanced view.
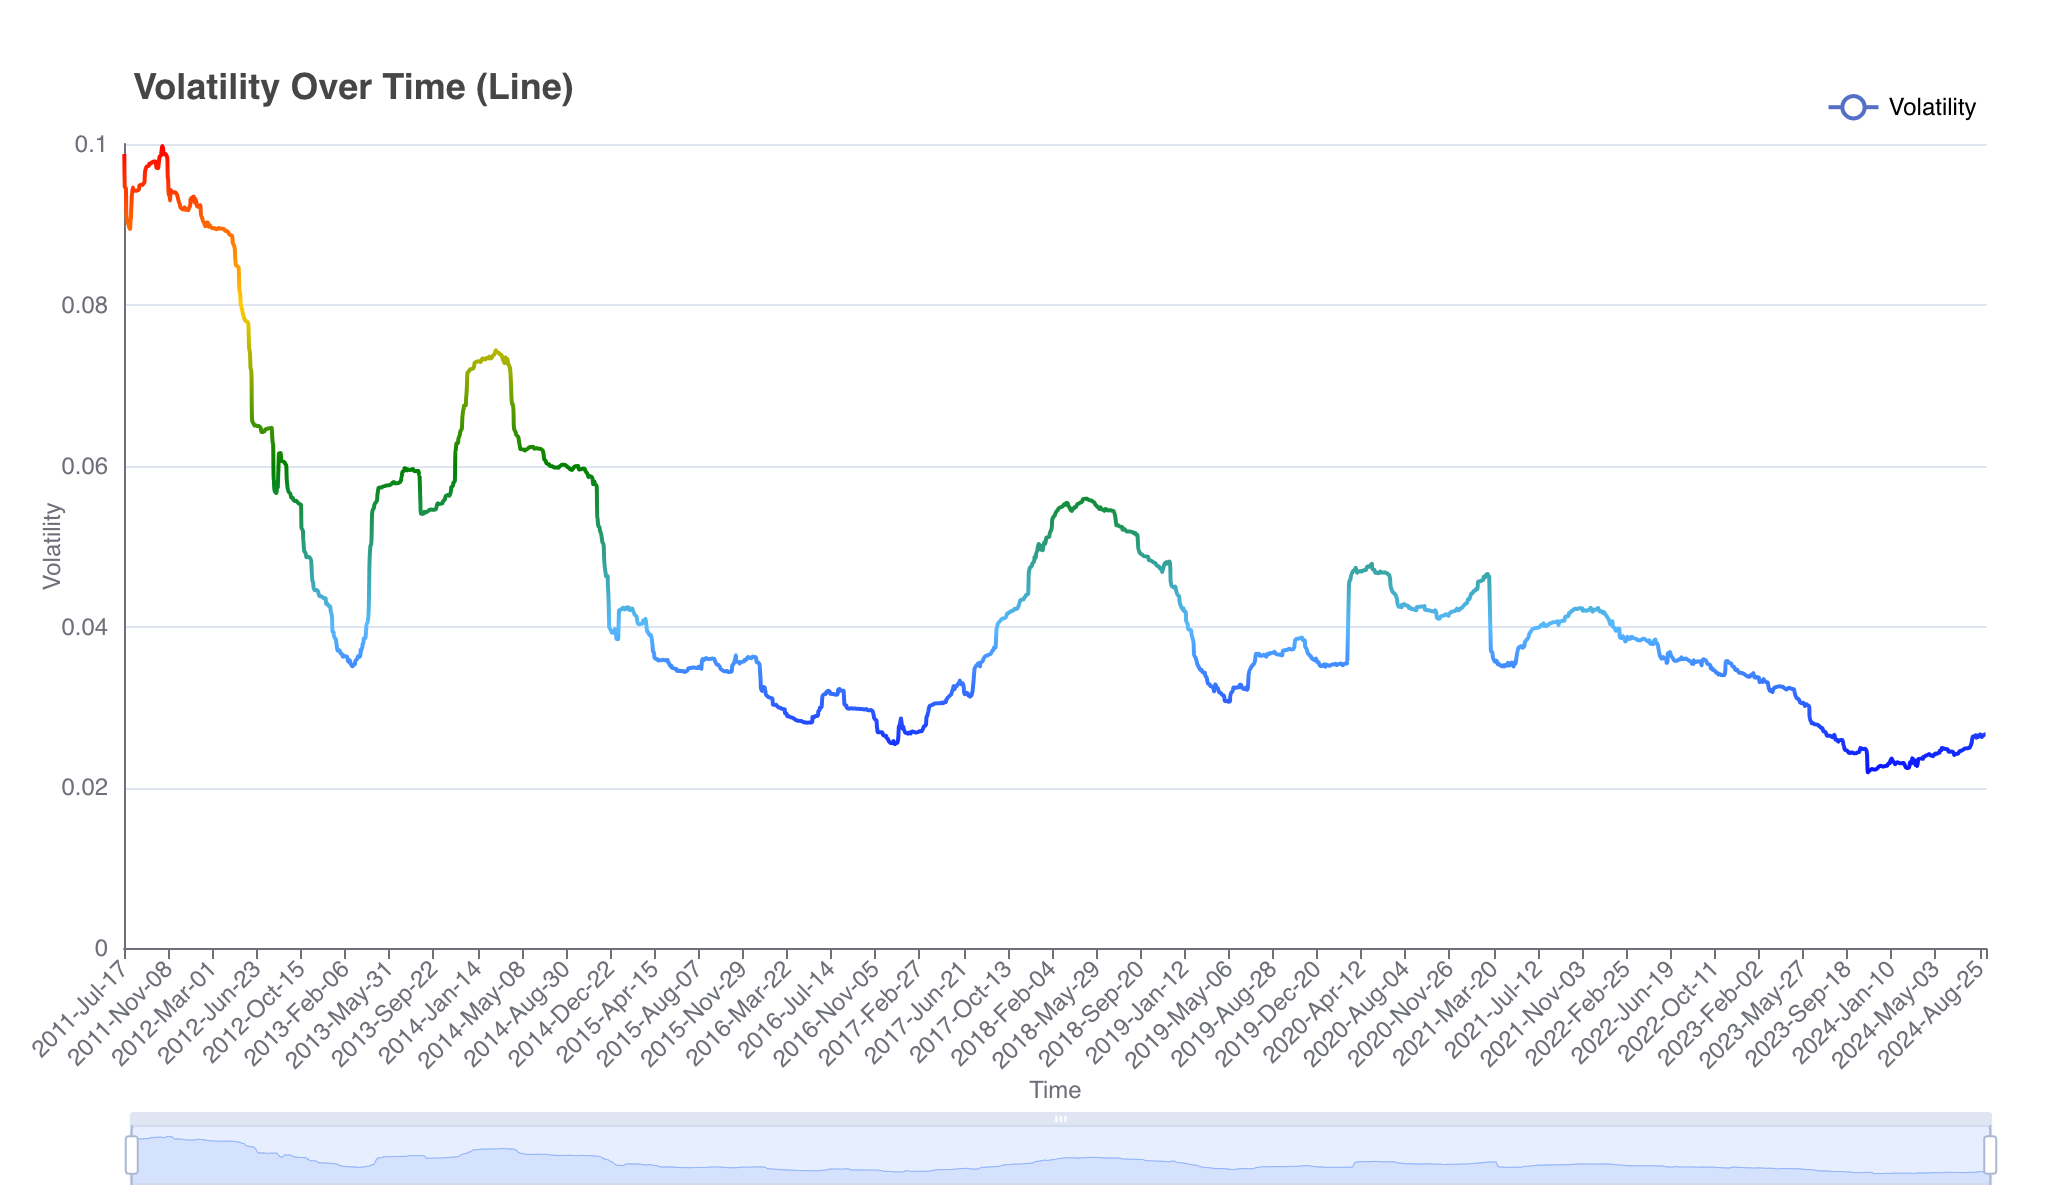
Volatility Over Time (Line Chart)
This line chart depicts the changes in Bitcoin's volatility over time. By visualizing historical volatility, it helps in understanding that Bitcoin's volatile price movements are decreasing as a function of time.
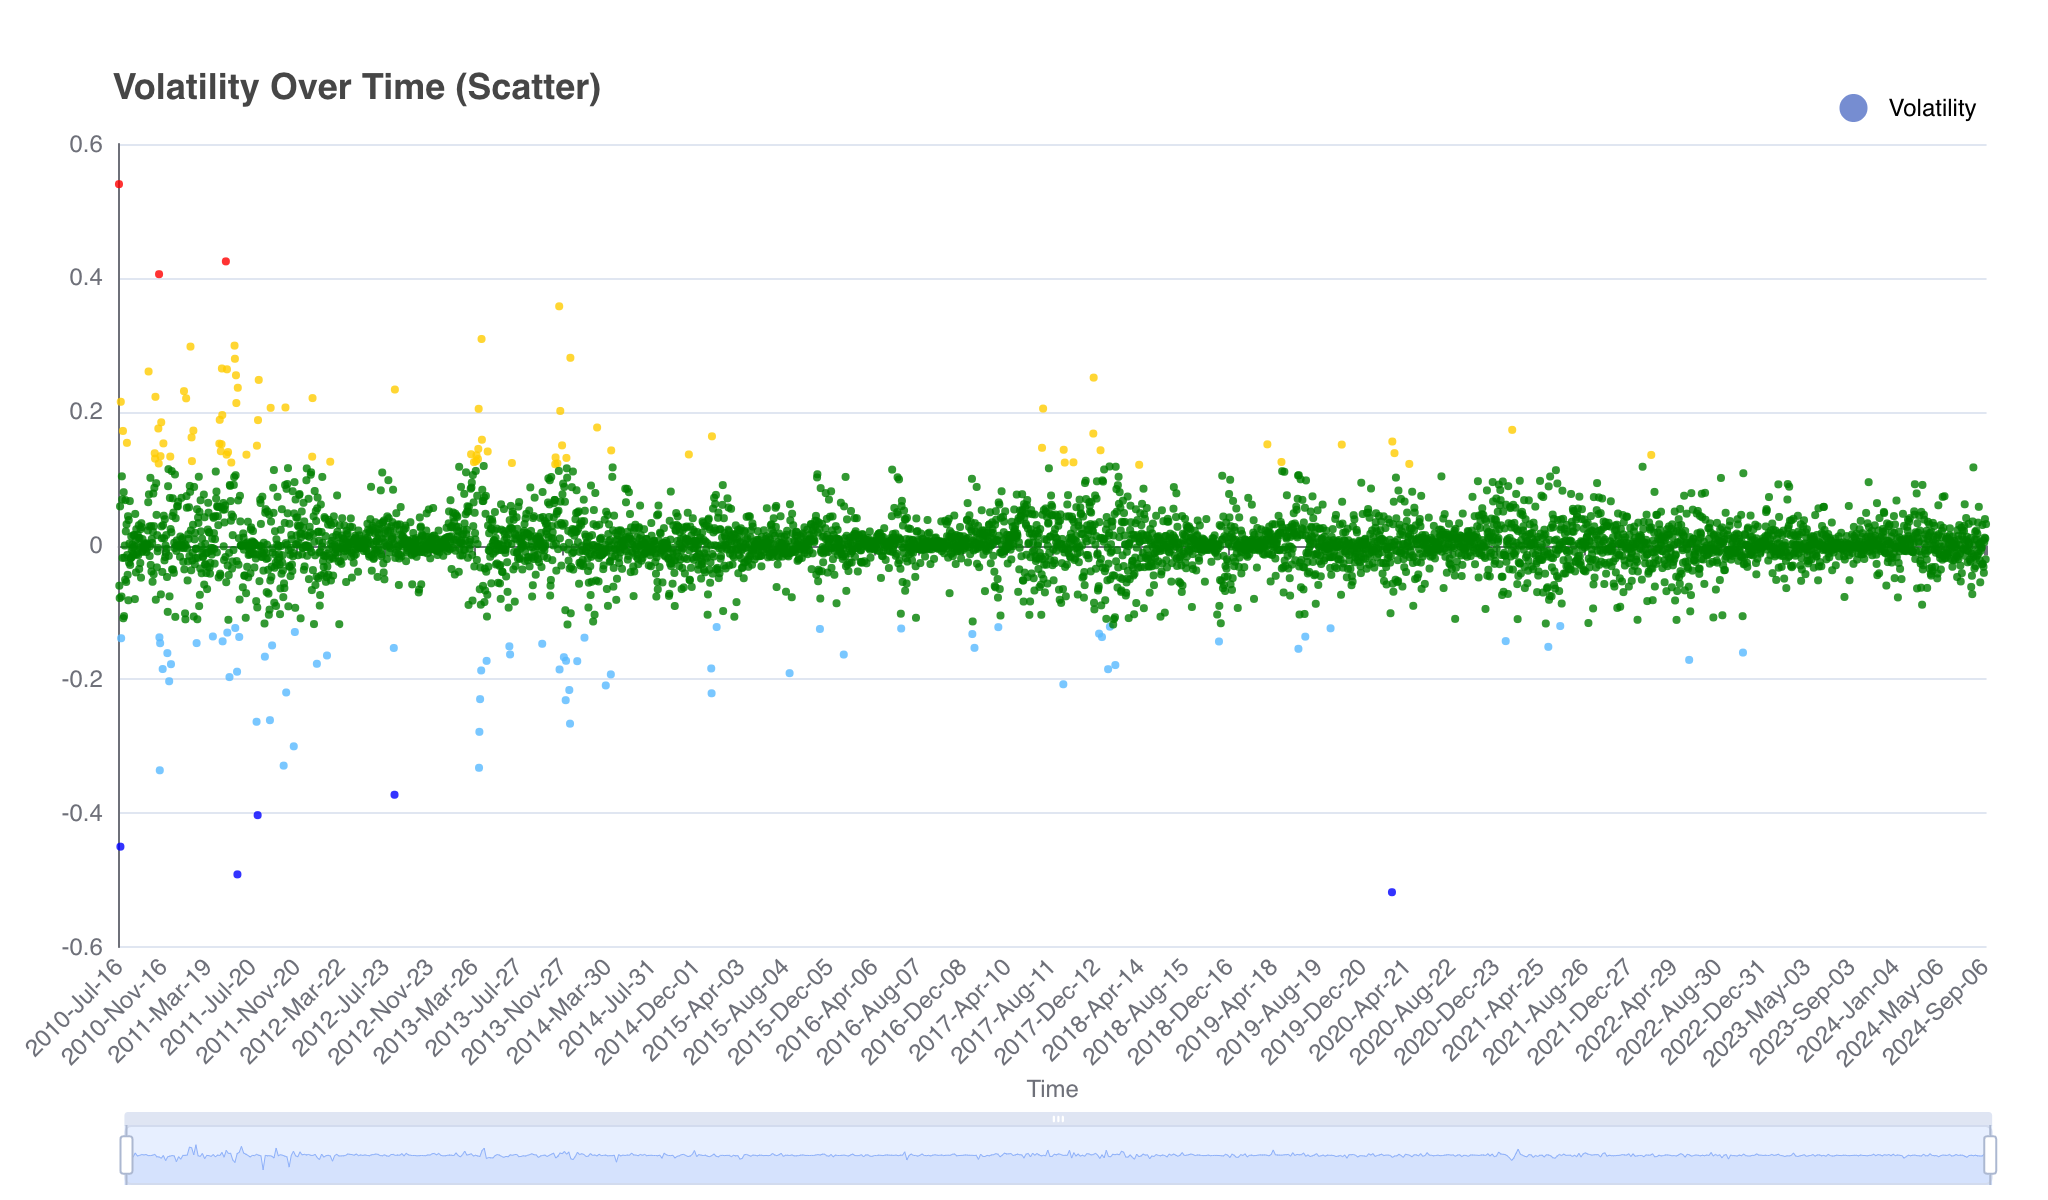
Volatility Over Time (Scatter Plot)
This scatter plot chart depicts the changes in Bitcoin's volatility over time. It provides the same data as the 'Volatility Over Time Line Chart', but visualized in a scatter-plot.
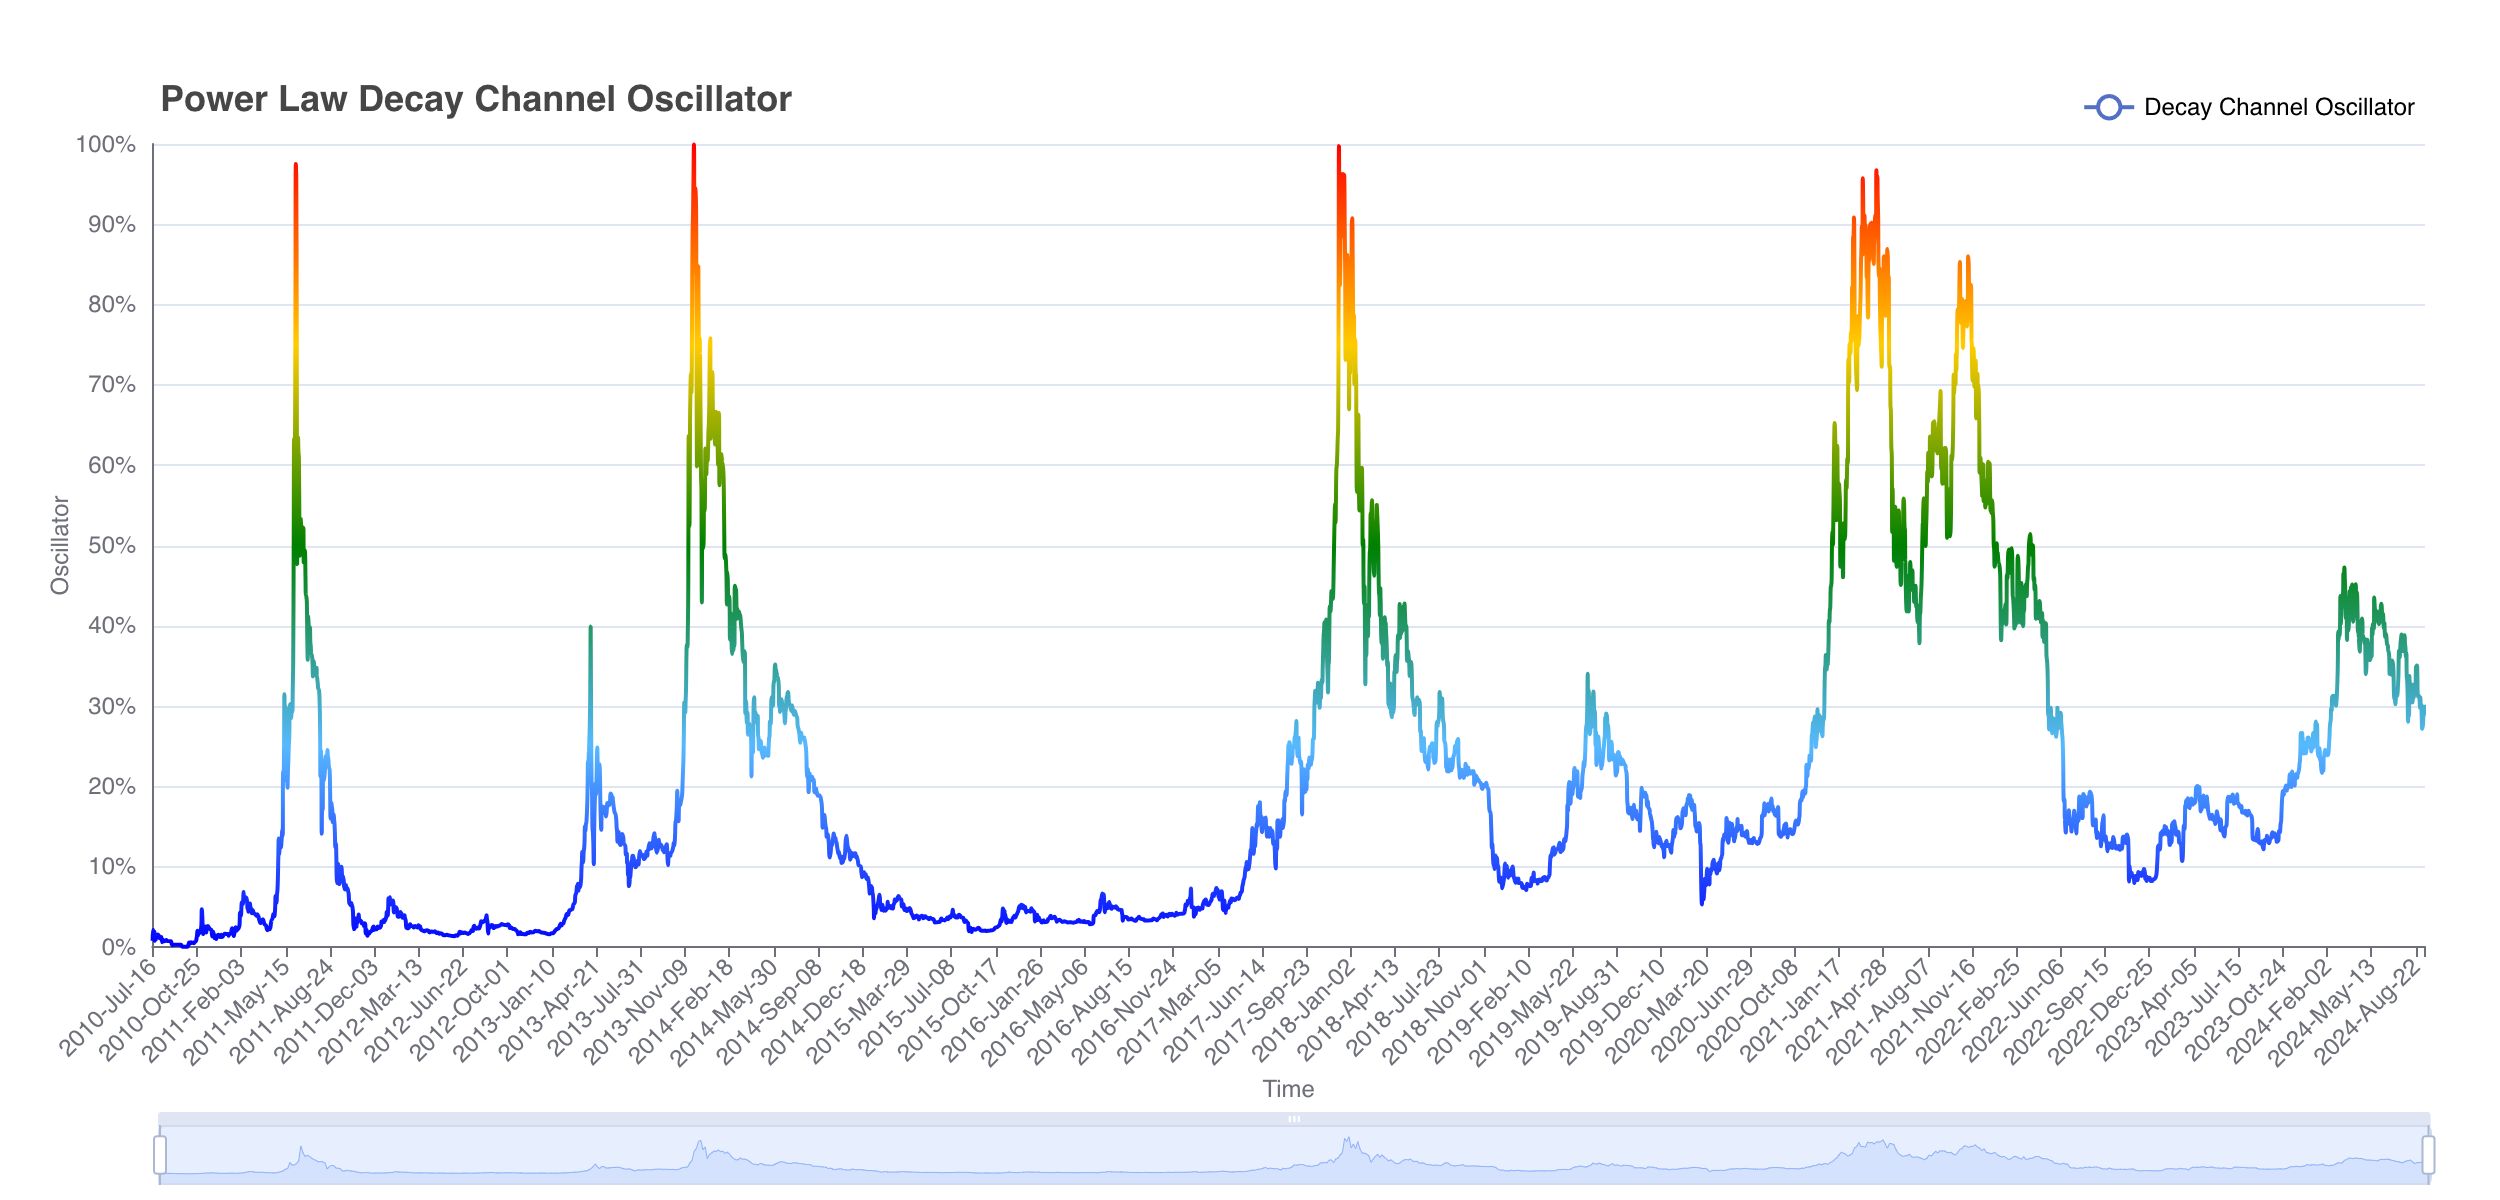
Power Law Decay Channel Oscillator
The Power Law Decay Channel Oscillator tracks the decay of Bitcoin's price movement over time within a predefined channel (defined by the 5th Quantile & Decay Regression Fit). The channel normalizes for the diminishing returns to help identify overbought and oversold conditions.
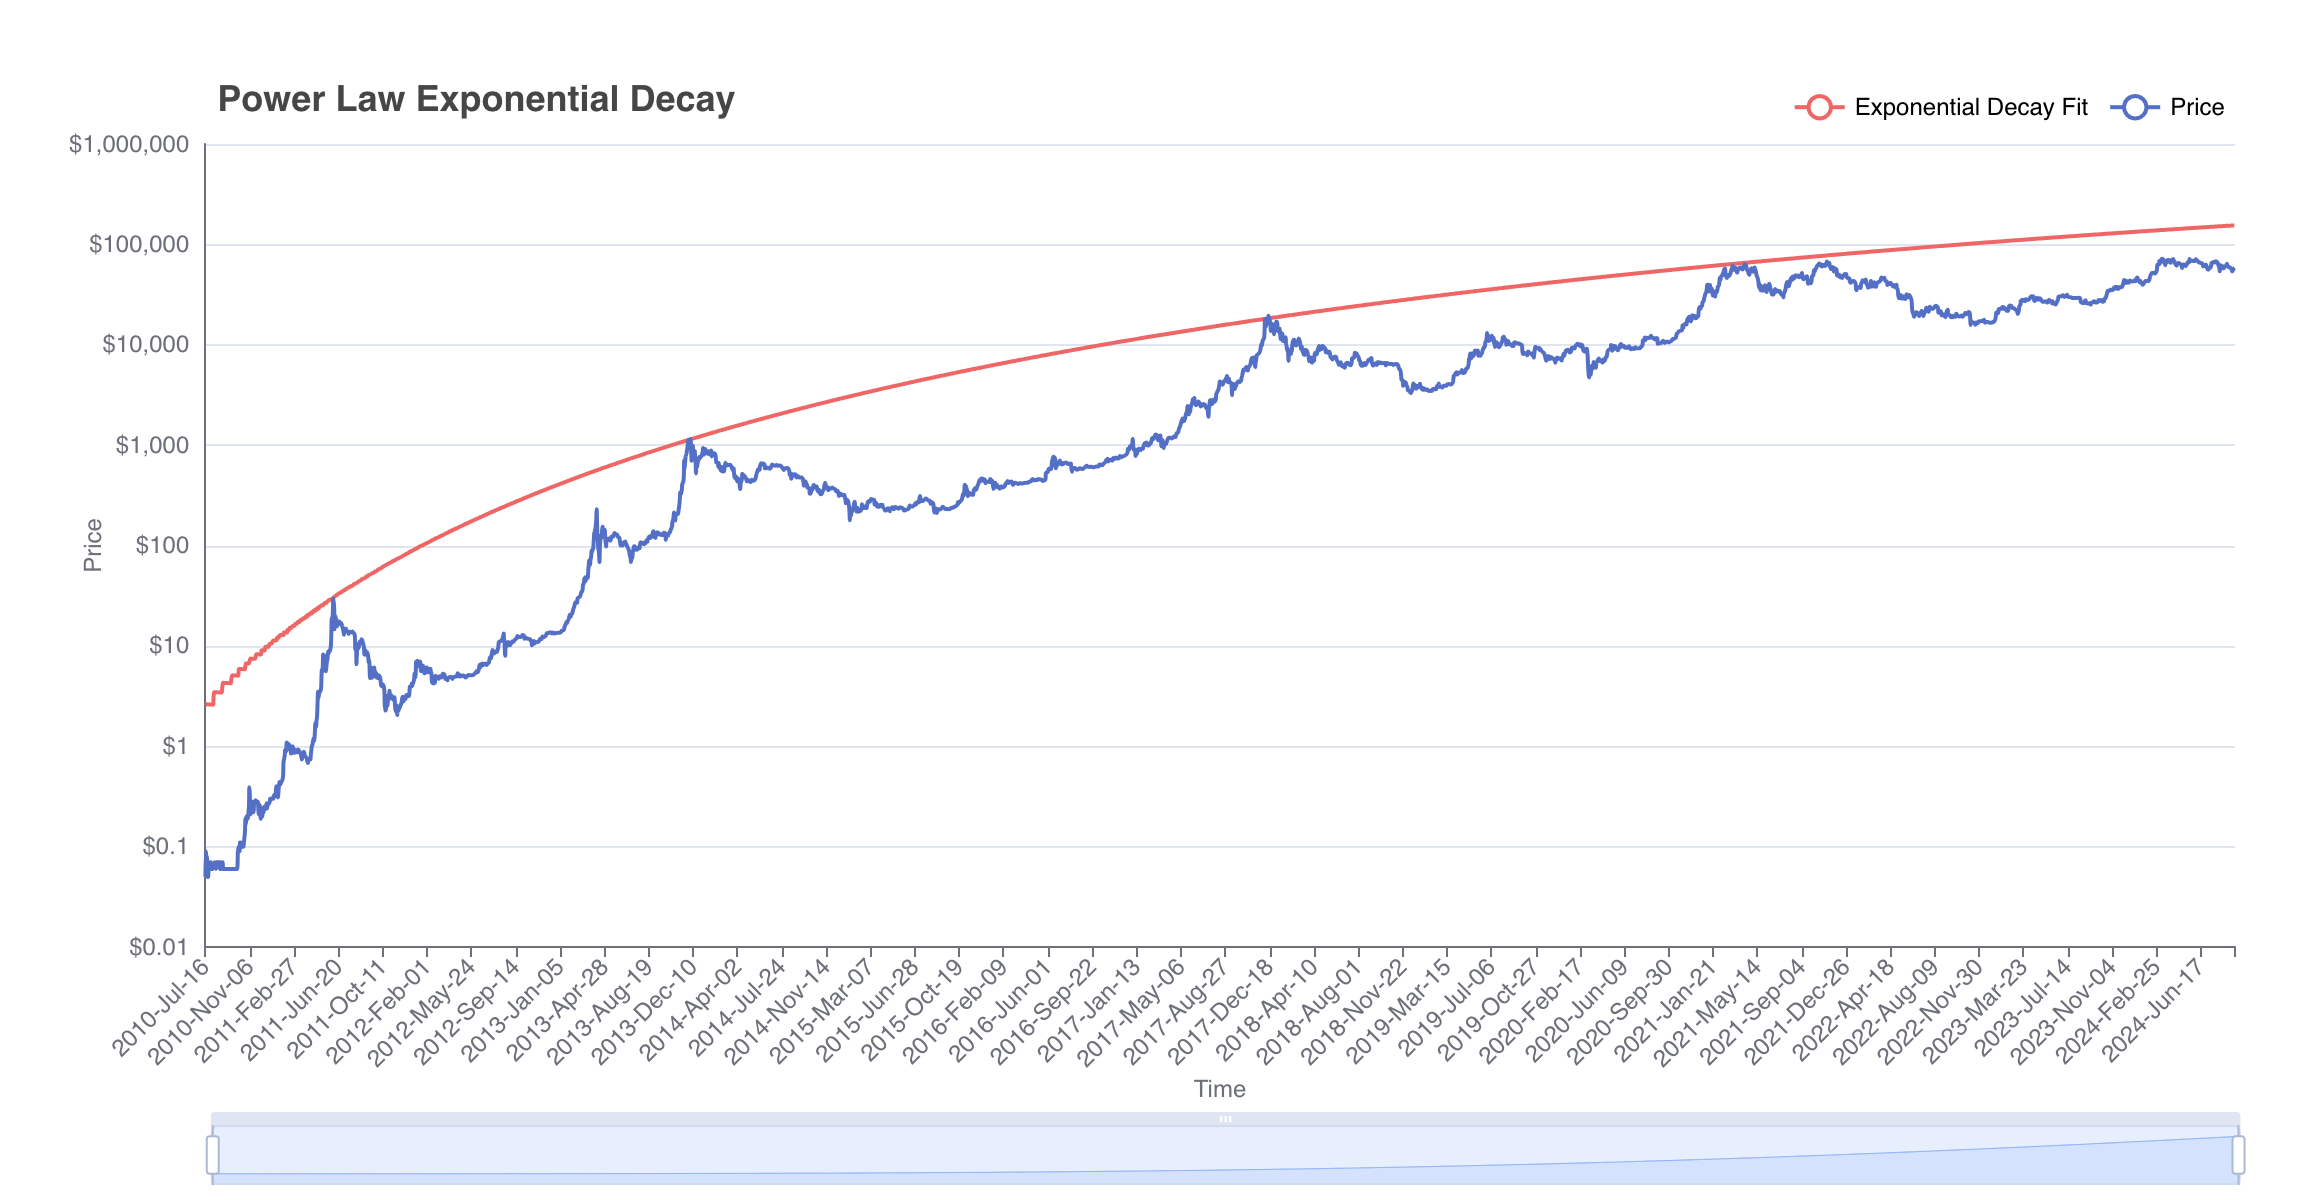
Power Law Exponential Decay
The Power Law Exponential Decay chart visualizes the exponential decay of Bitcoin's price from its peak. The peak in each 4-year halving cycle has been used to define the Decay Regression, so that the next peak can the extrapolated.
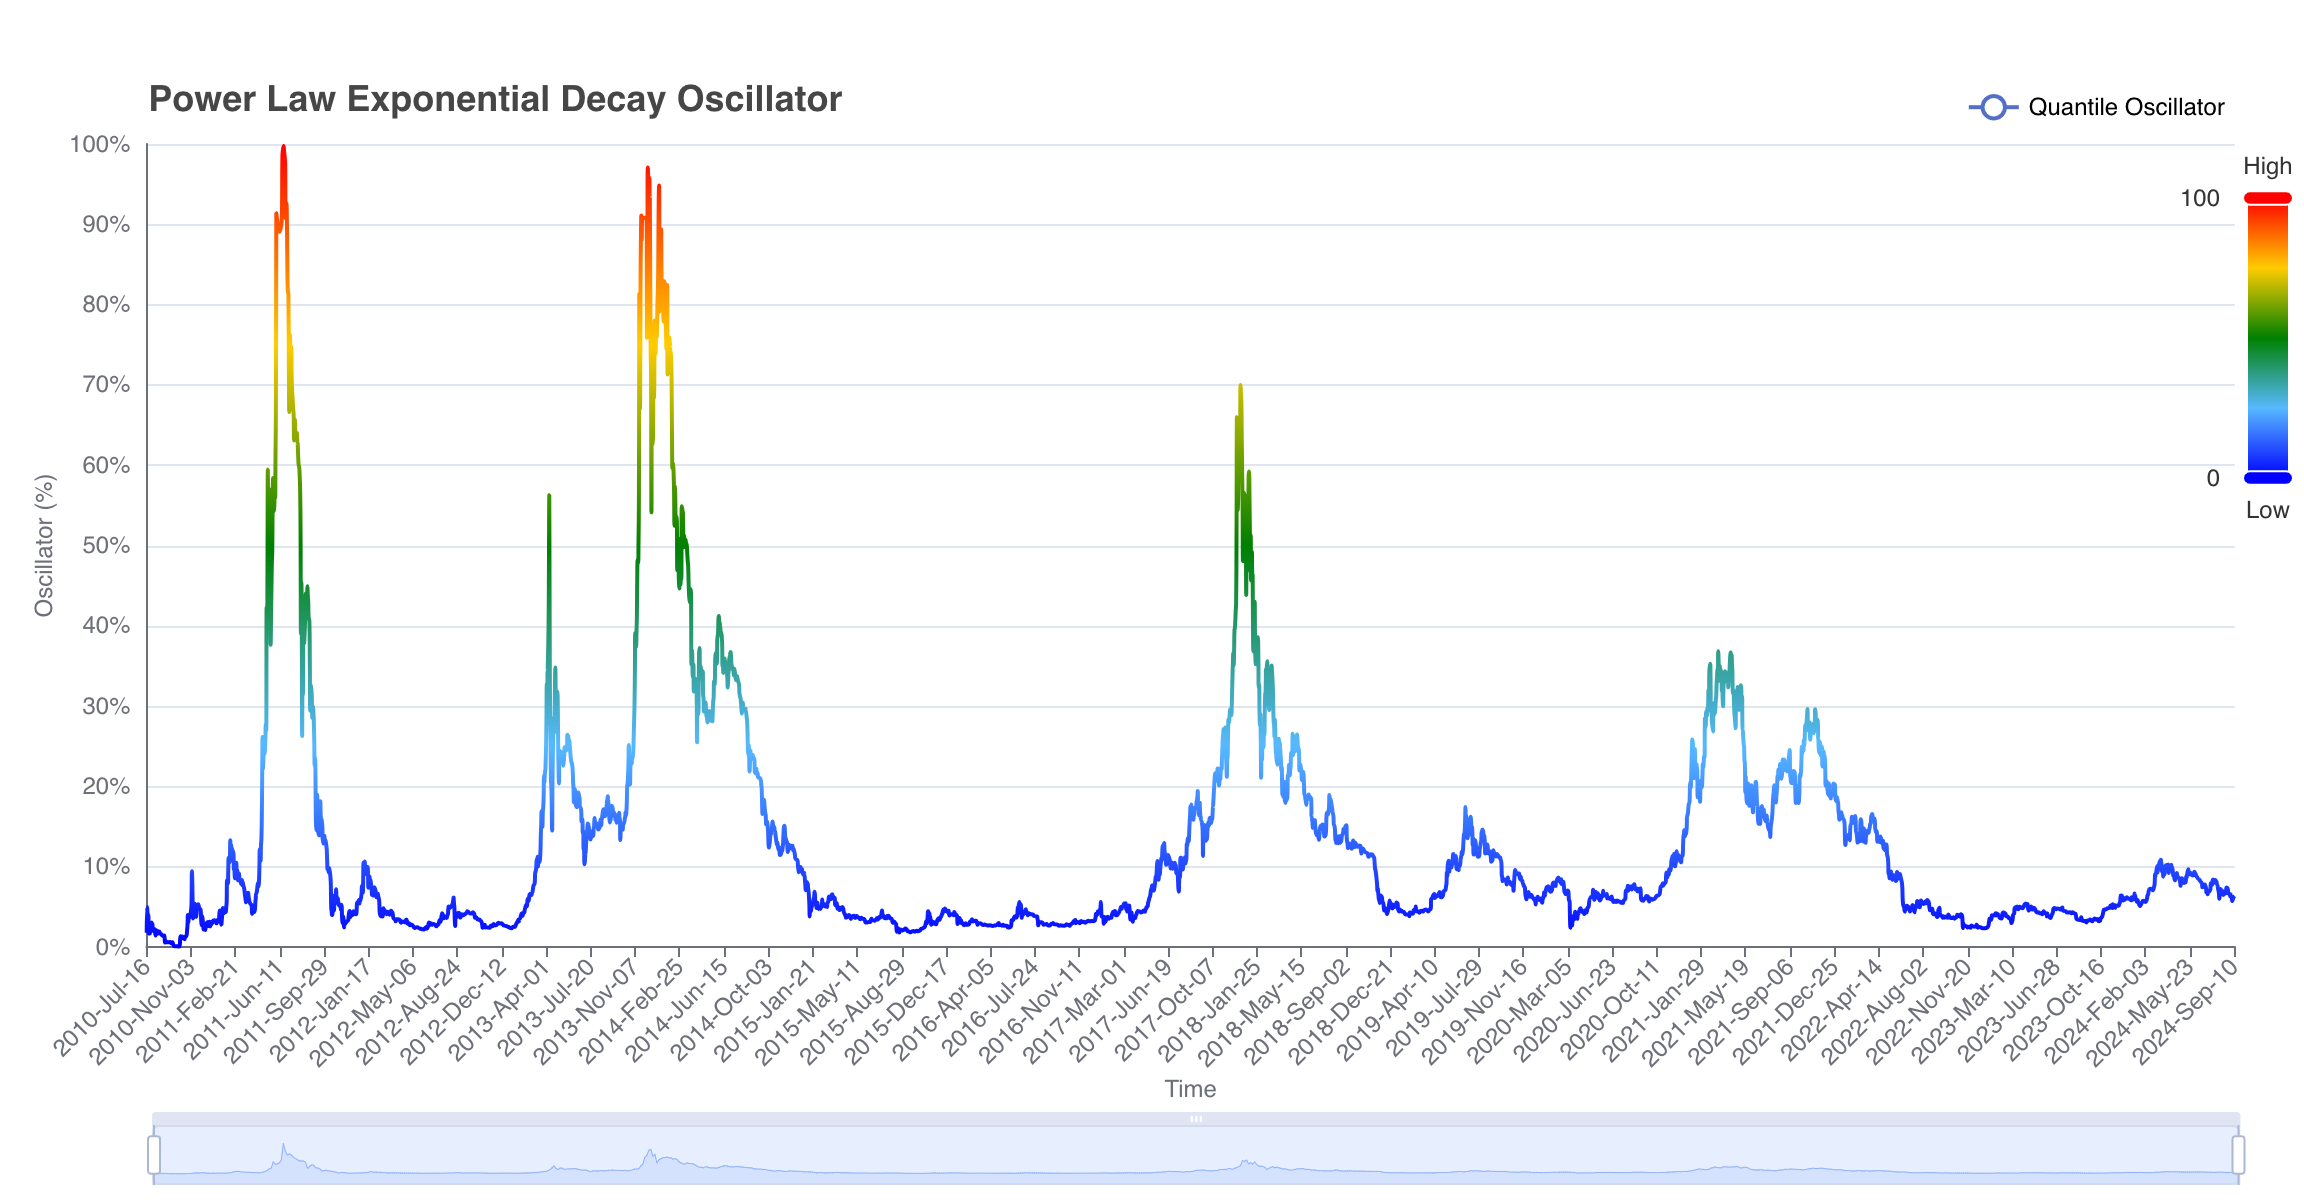
Power Law Exponential Decay Oscillator
The Power Law Exponential Decay Oscillator tracks the decay of Bitcoin's price movement over time within a predefined channel (defined by the 5th Quantile & Decay Regression Fit). The oscillator does not channel normalize for the diminishing returns.
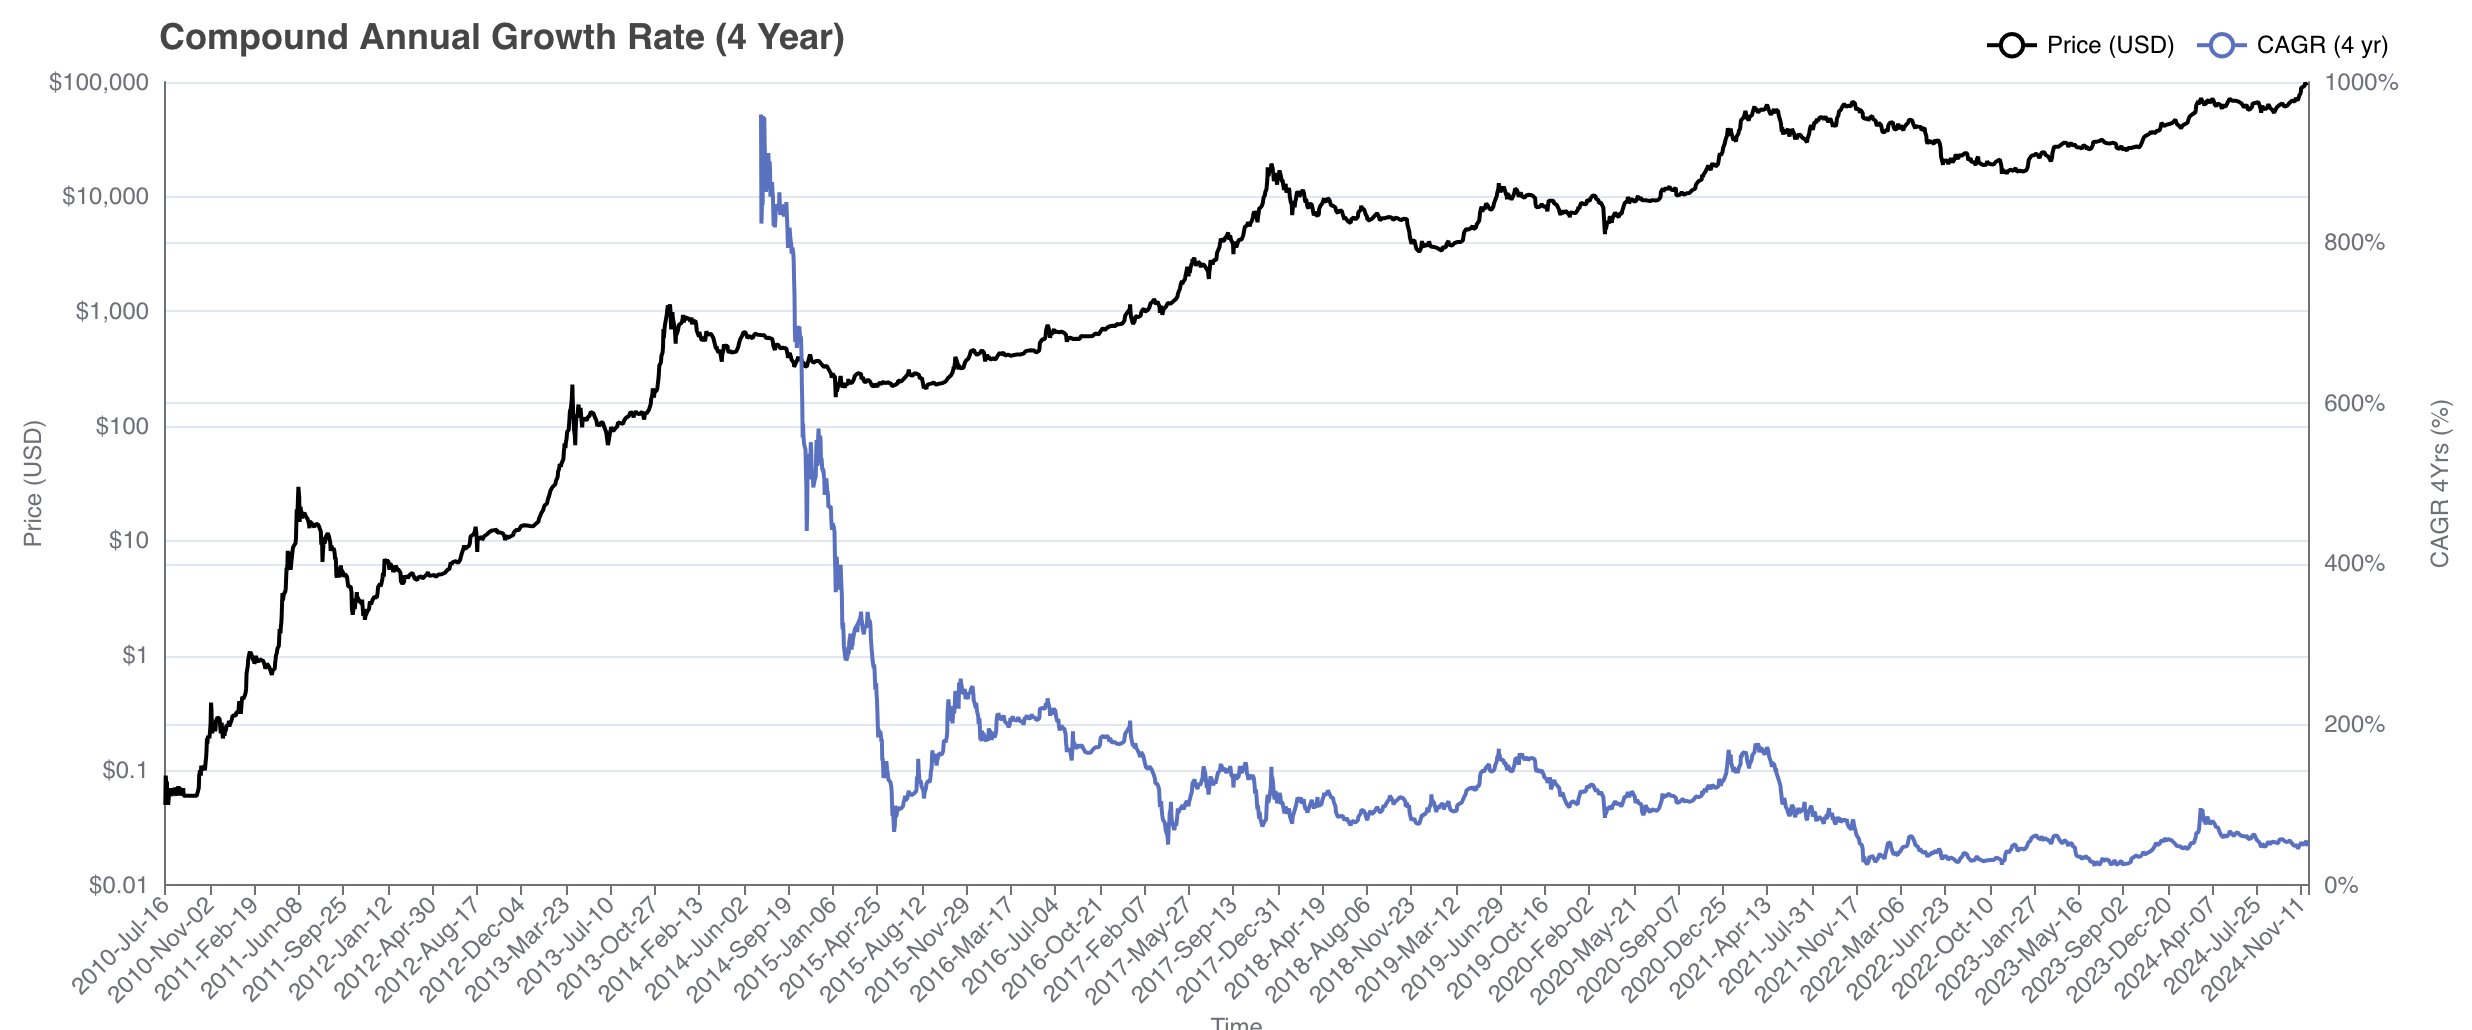
Compound Annual Growth Rate (4 Year)
This chart tracks Bitcoin's 4-year compound annual growth rate (CAGR), a key metric that reveals its sustained and volatile long-term performance across market cycles. By measuring the annualized rate of return over rolling 4-year periods, this chart highlights Bitcoin's historical ability to generate strong returns despite significant market fluctuations.
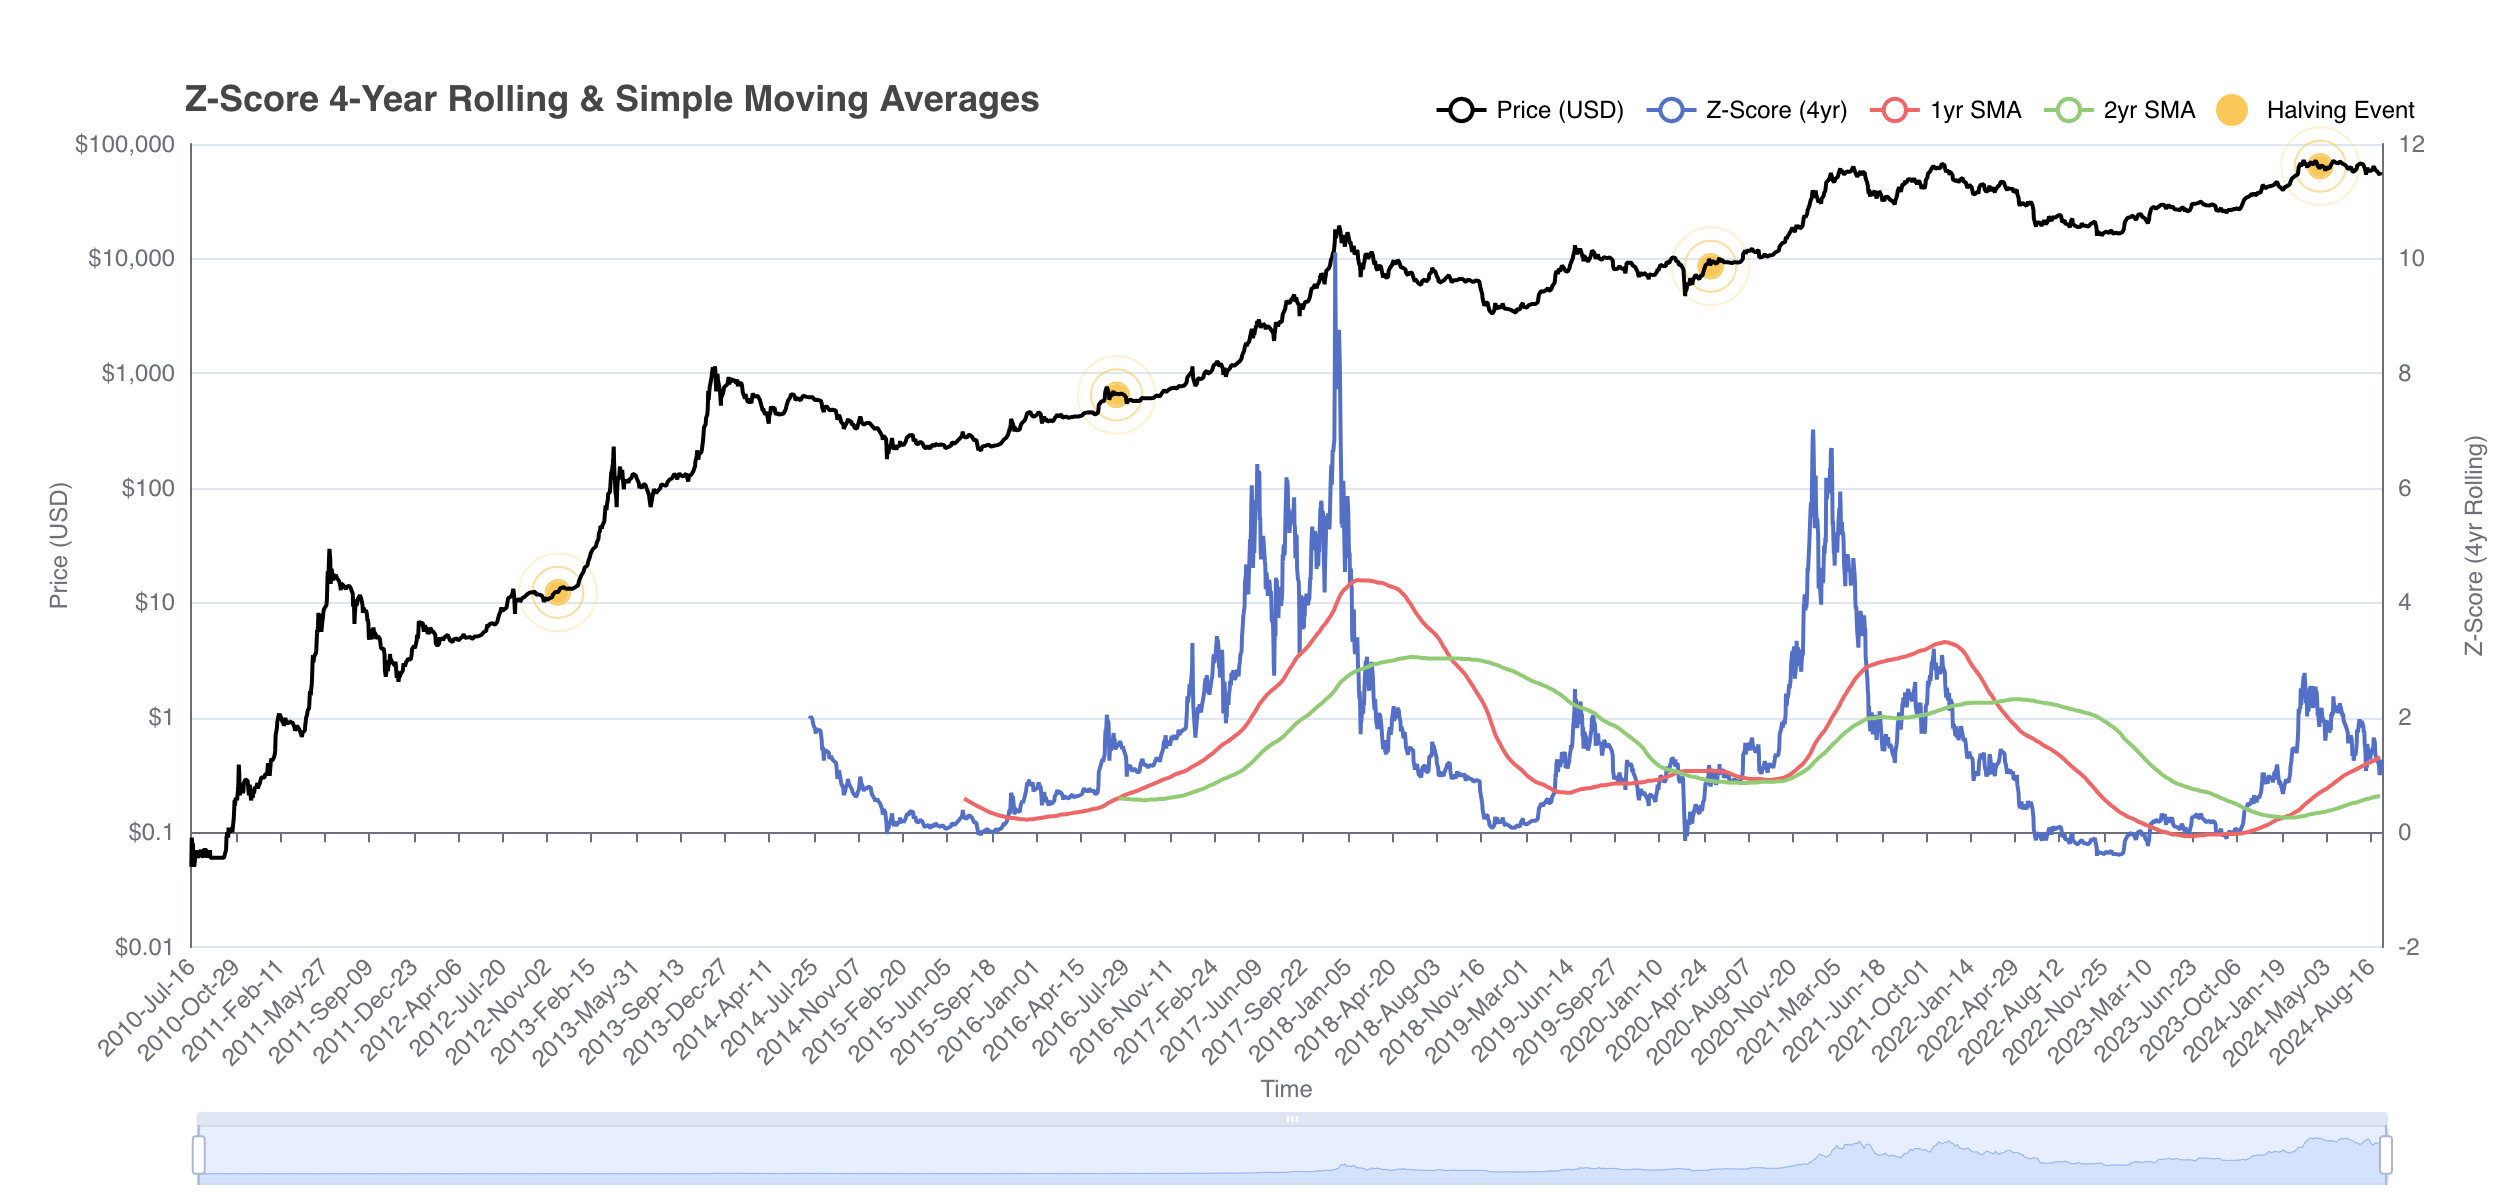
Z-Score 4 Year Rolling and Simple Moving Averages
This chart tracks the Z-Score of Bitcoin's price based on 4-year rolling averages. The chart also overlays 1-year and 2-year Simple Moving Averages. The chart helps identify how far the price deviates from its historical norm, making it useful for long-term trend analysis.
© 2025 ₿itcoin Good Fiat Bad, Inc. All rights reserved.

